vue3 实现echarts根据页面大小进行自适应
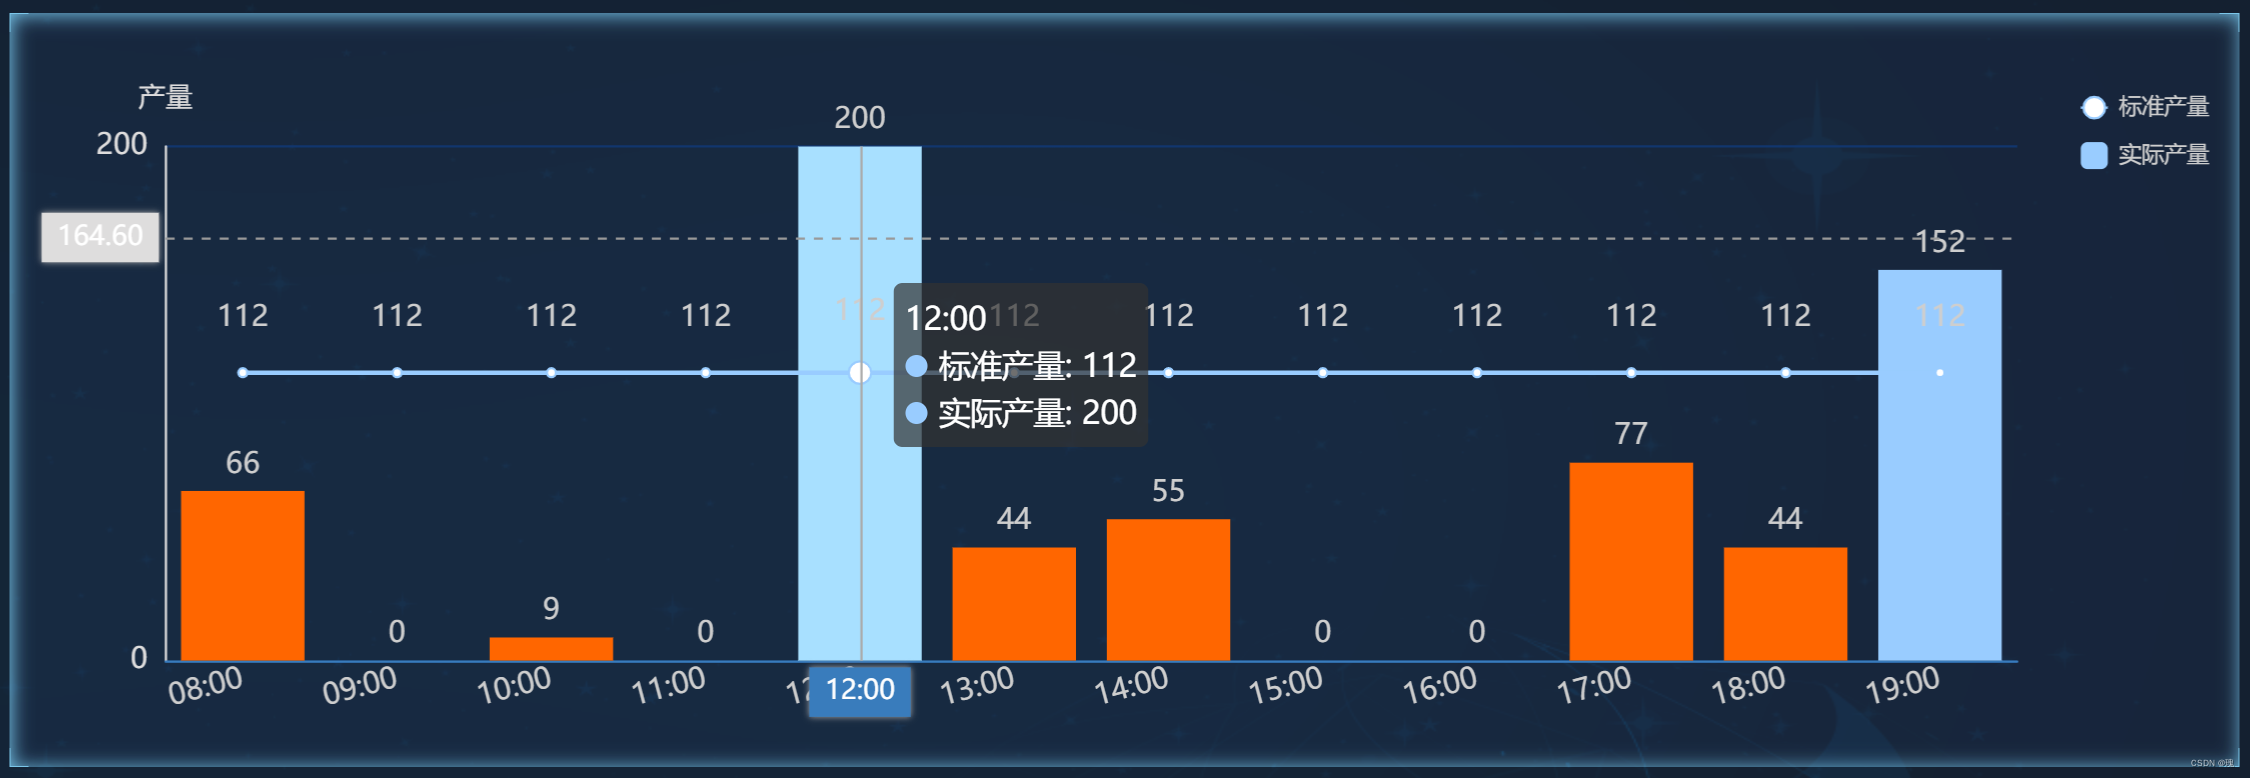
效果图:
1. 工具代码
debounce代码 === @/utils/index
/**
 *  函数防抖
 *  @param {Function} func  包装的函数
 *  @param {num} delay      延迟时间
 *  @param {boolean} immediate 第一次滚动会执行两次  开始滚动和结束滚动的时候
 *  @return {*}
 */

export function debounce(func, delay, immediate = false) {
  let timer,
    context = this;
  return (...args) => {
    if (immediate) {
      func.apply(context, args);
      immediate = false;
      return;
    }
    clearTimeout(timer);
    timer = setTimeout(() => {
      func.apply(context, args);
    }, delay);
  };
}
页面关键代码块
    import {debounce} from "@/utils/index";
    const resizeHandler = debounce(() => {
        if (myChart) {
            myChart.resize();
        }
    }, 200)

    onMounted(() => {
        getChartData()
        window.addEventListener("resize", resizeHandler)
    })
    onBeforeUnmount(() => {
        window.removeEventListener("resize", resizeHandler)
    })
页面完整代码:
<template>
    <div class="chart-wrapper" ref="cityCount" v-if="tableData.length > 0"></div>
    <el-empty description="暂无数据" v-else :image="emptyImage"/>
</template>

<script setup>
    import echarts from "echarts";
    import {onMounted, onBeforeUnmount, ref, watch} from "vue";
    import {getCurrentInstance, nextTick} from "@vue/runtime-core";
    import {debounce} from "@/utils/index";
    import {ElLoading, ElMessage} from "element-plus"

    const {proxy} = getCurrentInstance()
    const emptyImage = ref(require('@/assets/image/nodata.png'))
    const cityCount = ref(null);
    let myChart = ref(null);
    const tableData = ref([])

    const resizeHandler = debounce(() => {
        if (myChart) {
            myChart.resize();
        }
    }, 200)

    onMounted(() => {
        getChartData()
        window.addEventListener("resize", resizeHandler)
    })
    onBeforeUnmount(() => {
        window.removeEventListener("resize", resizeHandler)
    })
    //获取echarts数据
    const getChartData = () => {
        tableData.value = [{
            "timeChar": "08",
            "standard": "112",
            "actual": "66",
            "upToSta": "1",
        }, {
            "timeChar": "09",
            "standard": "112",
            "actual": "0",
            "upToSta": "1",
        }, {
            "timeChar": "10",
            "standard": "112",
            "actual": "9",
            "upToSta": "1",
        }, {
            "timeChar": "11",
            "standard": "112",
            "actual": "0",
            "upToSta": "1",
        }, {
            "timeChar": "12",
            "standard": "112",
            "actual": "200",
            "upToSta": "0",
        }, {
            "timeChar": "13",
            "standard": "112",
            "actual": "44",
            "upToSta": "1",
        }, {
            "timeChar": "14",
            "standard": "112",
            "actual": "55",
            "upToSta": "1",
        }, {
            "timeChar": "15",
            "standard": "112",
            "actual": "0",
            "upToSta": "1",
        }, {
            "timeChar": "16",
            "standard": "112",
            "actual": "0",
            "upToSta": "1",
        }, {
            "timeChar": "17",
            "standard": "112",
            "actual": "77",
            "upToSta": "1",
        }, {
            "timeChar": "18",
            "standard": "112",
            "actual": "44",
            "upToSta": "1",
        }, {
            "timeChar": "19",
            "standard": "112",
            "actual": "152",
            "upToSta": "0",
        }
        ]
        let xData = [],
            upToSta = [],
            yDataStandard = [],
            yDataProduction = [];
        tableData.value.forEach((item) => {
            xData.push(item.timeChar + ':00')
            upToSta.push(item.upToSta || 0)
            yDataStandard.push(item.standard || 0)
            yDataProduction.push(item.actual || 0)
        })

        nextTick(() => {
            initEcharts(xData, upToSta, yDataStandard, yDataProduction)
        })
    }

    //渲染echarts图
    const initEcharts = (xData, upToSta, yDataStandard, yDataProduction) => {
        myChart = echarts.init(cityCount.value);
        myChart.setOption(
            {
                grid: {
                    left: "7%",
                    right: "10%",
                    bottom: "15%",
                    top: "12%",
                },
                title: {},
                tooltip: {
                    trigger: 'axis',
                    axisPointer: {
                        type: 'cross',
                        crossStyle: {
                            color: '#999'
                        }
                    }
                },
                toolbox: {
                    feature: {
                        dataView: {
                            show: false,
                        },
                        restore: {
                            show: false,
                        },
                    },
                    iconStyle: {
                        normal: {
                            borderColor: "#1990DA",
                        },
                    },
                    top: 0,
                    right: 5,
                },
                color: ['#99CCFF', '#49e294', '#99CCFF', '#49e294'],
                legend: {
                    textStyle: {
                        fontSize: 10,
                        color: "#cecece",
                    },
                    type: 'scroll',
                    orient: 'vertical',
                    right: 7,
                    top: 10,
                    itemWidth: 12, // 宽
                    itemHeight: 12// 高
                },
                dataZoom: [
                    {
                        type: "inside",
                        startValue: 0,
                        endValue: 100,
                    },
                ],
                xAxis: {
                    type: "category",
                    axisLine: {
                        lineStyle: {
                            color: "#397cbc",
                        },
                    },
                    splitLine: {
                        show: false,
                    },
                    axisTick: {
                        show: false,
                    },
                    //轴线上的字
                    axisLabel: {
                        show: true,
                        textStyle: {
                            color: "#cecece",
                            fontSize: 13,
                        },
                        rotate: 15,
                    },
                    data: xData,
                },
                yAxis: [
                    {
                        type: 'value',
                        name: '产量',
                        min: 0,
                        interval: 500,
                        axisTick: {
                            show: false,
                        },
                        //轴线上的字
                        axisLabel: {
                            textStyle: {
                                fontSize: 13,
                                color: "#dedddd",
                            },
                            formatter: '{value}'
                        },
                        axisLine: {
                            lineStyle: {
                                color: "#dedddd",
                            },
                        },
                        //网格线
                        splitLine: {
                            lineStyle: {
                                color: "#11366e",
                            },
                        },
                    }
                ],
                series: [
                    {
                        name: '标准产量',
                        type: 'line',
                        data: yDataStandard,
                        label: {
                            position: 'top',
                            distance: 15,
                            show: true,
                            textStyle: {
                                fontSize: 13,
                                color: "#cecece",
                            },
                        },
                        itemStyle: {
                            color: new echarts.graphic.LinearGradient(0, 0, 0, 1, [
                                    {offset: 0, color: "#99CCFF",}
                                ], false
                            ),
                        },
                    },
                    {
                        name: '实际产量',
                        type: 'bar',
                        data: yDataProduction,
                        label: {
                            position: 'top',
                            show: true,
                            textStyle: {
                                fontSize: 13,
                                color: "#cecece",
                            },
                        },
                        itemStyle: {
                            //通常情况下:
                            normal: {
                                color: function (params) {
                                    if (upToSta[params.dataIndex] == 0) {
                                        return '#99CCFF'
                                    } else {
                                        return '#FF6600'
                                    }
                                }
                            },
                        }
                    }
                ],
            },
            true
        );
    }
</script>