echarts 堆叠柱状图 顶端圆角
echarts 堆叠柱状图被很多项目广泛的使用。需求是 堆叠柱状图 顶端圆角,下面是实现过程。
安装或引入echarts,正常的使用方法可以看官方文档,直接上代码:
option = {
xAxis: [
{
type: 'category',
data: ['Mon', 'Tue', 'Wed', 'Thu', 'Fri', 'Sat', 'Sun']
}
],
yAxis: [
{
type: 'value'
}
],
series: [
{
name: 'Google',
type: 'bar',
stack: 'Search Engine',
emphasis: {
focus: 'series'
},
data: [120, 8, 101, 134, 290, 230, 220],
},
{
name: 'Bing',
type: 'bar',
stack: 'Search Engine',
emphasis: {
focus: 'series'
},
data: [60, 72, 71, 74, 190, 130, 110]
},
{
name: 'Others',
type: 'bar',
stack: 'Search Engine',
emphasis: {
focus: 'series'
},
data: [62, 82, 91, 84, 109, 110, 120],
itemStyle: {
barBorderRadius: [12, 12, 0, 0],
}
}
]
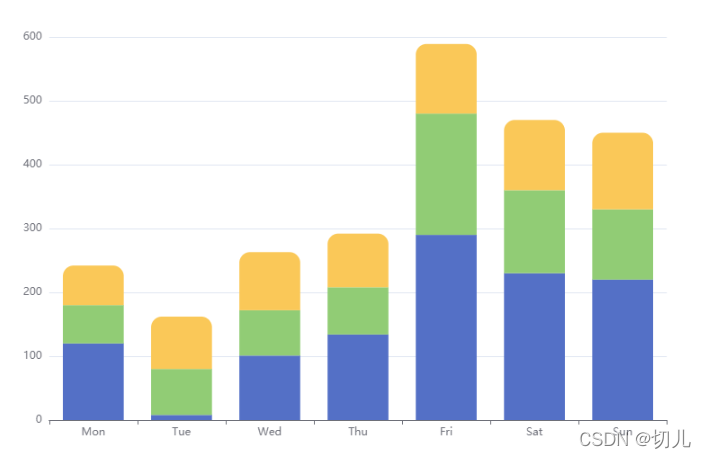
};代码效果:黄色other 绿色Bing 蓝色Google
目前顶端都是圆角的,但是如果黄色other数据为0的话,就会出现问题 ,可以代码中修改other数据为data: [62, 82, 91, 0, 109, 0, 120],就是出现下图问题:
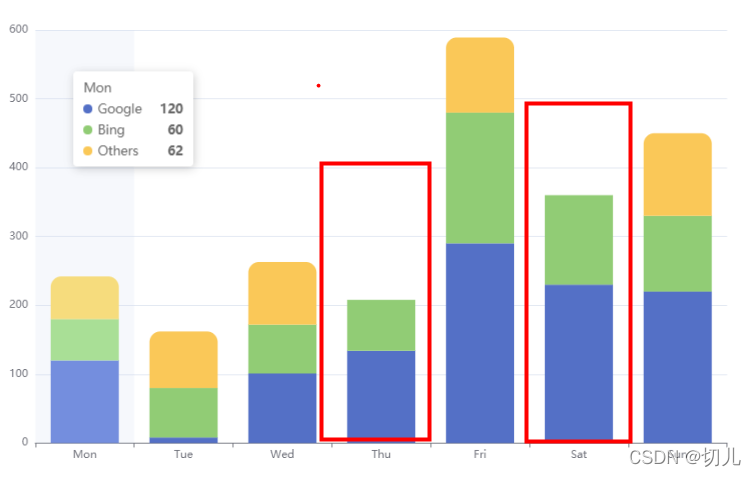
那么需要处理的是 不管是谁,只要谁在上面,就变为圆角的。(也就是 上面的数据为0,那相邻的下面的处理为圆角)
解决方法 (只是按照现在的一种方式实现,还有其他方法可以解决)
{
      name: 'Bing',
      type: 'bar',
      stack: 'Search Engine',
      emphasis: {
        focus: 'series'
      },
      data: [ { //遍历数据 看红色的第一个数据 如果不为0,则barBorderRadius: [0, 0, 0, 0];为0则barBorderRadius: [12, 12, 0, 0],
          value: 50,
          label: {},
          itemStyle: {
            barBorderRadius: [12, 12, 0, 0],
          }
        },{
          value: 50,
          label: {},
          itemStyle: {
            barBorderRadius: [0, 0, 0, 0],
          }
        }]
    },
效果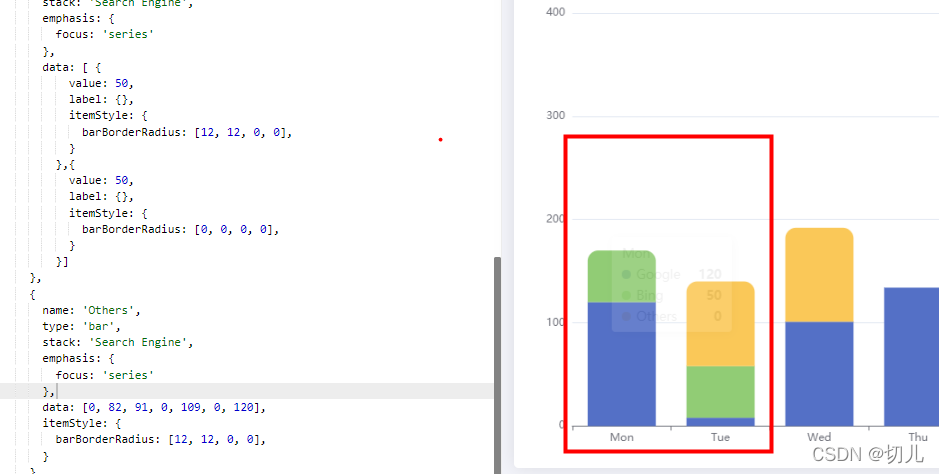
data的数据可以设置成 参数 比如
//otherData 是逻辑处理出来的结果,逻辑代码这里就不说了,大概就是 根据堆叠颜色一次判断是否为0,再给出对应的barBorderRadius
othrtData =  [{
          value: 50,
          label: {},
          itemStyle: {
            barBorderRadius: [12, 12, 0, 0],
          }
        },{
          value: 50,
          label: {},
          itemStyle: {
            barBorderRadius: [0, 0, 0, 0],
          }
        }];
data = othrtData;
希望能看的明白!