如何5分钟快速搭建一套JVM线上监控工具
一、Springboot项目配置
1. pom文件中导入如下依赖
   <!--实现JVM数据监控-->
        <dependency>
            <groupId>org.springframework.boot</groupId>
            <artifactId>spring-boot-starter-actuator</artifactId>
        </dependency>

        <!--prometheus实现jvm数据采集-->
        <dependency>
            <groupId>io.micrometer</groupId>
            <artifactId>micrometer-registry-prometheus</artifactId>
        </dependency>
2. 配置application.properties文件或者application.yml文件
2.1 配置application.properties文件
spring.application.name=springboot
server.port=8080
management.endpoints.web.exposure.include=*
management.metrics.tags.application=${spring.application.name}
2.2 配置application.yml文件
  application:
    name: springboot
  management:
    endpoint:
      web:
        exposure:
          include: *

    metrics:
      tags:
        application: ${spring.application.name}
3. 添加监控JVM的bean配置,或者重新创建一个配置类
@SpringBootApplication
public class JvmMonitorDemoApplication{

    public static void main(String[] args) {
        SpringApplication.run(JvmMonitorDemoApplication.class, args);
    }


    /**监控jvm的配置*/
    @Bean
    public MeterRegistryCustomizer<MeterRegistry> configurer(@Value("${spring.application.name}") String applicationName) {
        return registry -> registry.config().commonTags("application", applicationName);
    }


}
创建配置类如下:
@Configuration
public class JvmMonitorConfig {

    /**监控jvm的配置Bean*/
    @Bean
    public MeterRegistryCustomizer<MeterRegistry> configurer(@Value("${spring.application.name}") String applicationName) {
        return registry -> registry.config().commonTags("application", applicationName);
    }


}
4. 启动springboot项目
访问 http://localhost:8080/actuator/prometheus 查看指标是否正常
二、Prometheus配置
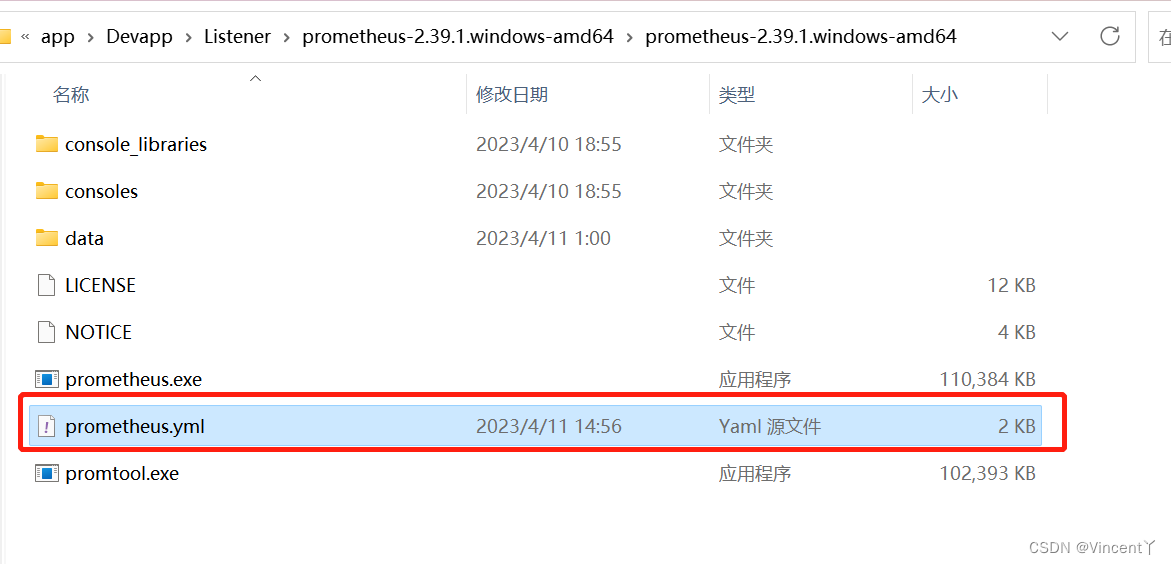
2.1 在prometheus.yml文件中添加scrape_configs 的如下配置:
# 任务名称,自定义,我取名叫jvm,你可以取名为其他的
- job_name: "jvm"
    # 多久采集一次数据
    scrape_interval: 5s
    # 采集时的超时时间
    scrape_timeout: 5s
    # 采集的路径
    metrics_path: '/actuator/prometheus'
    # 采集Springboot服务的地址
    static_configs:
      - targets: ['127.0.0.1:8080']
2.2 启动prometheus
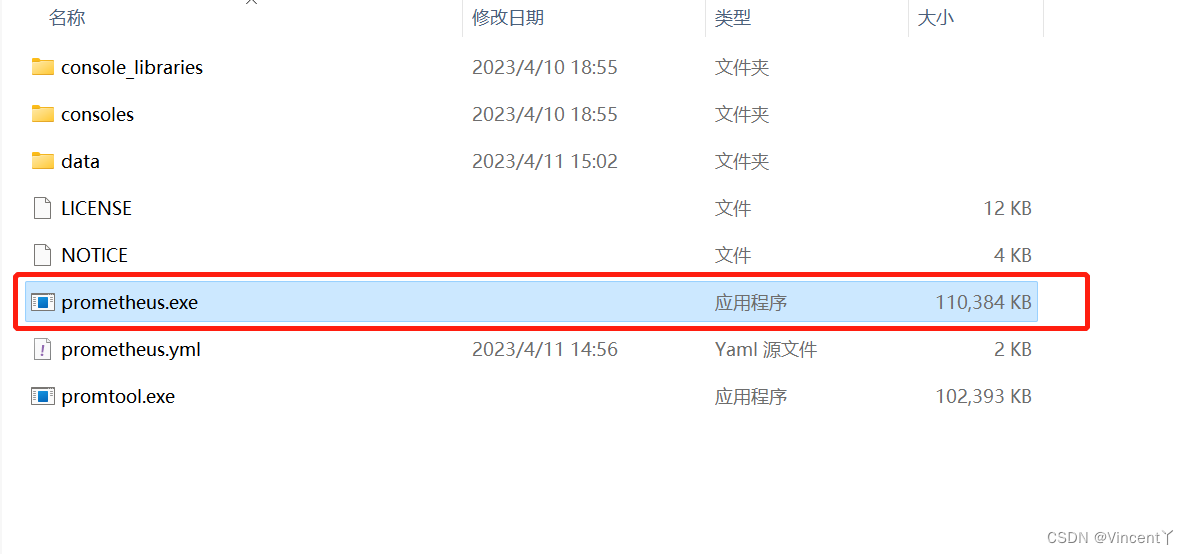
2.2.1 双击prometheus.exe 启动
2.2.2 命令行启动
prometheus.exe --config.file=prometheus.yml
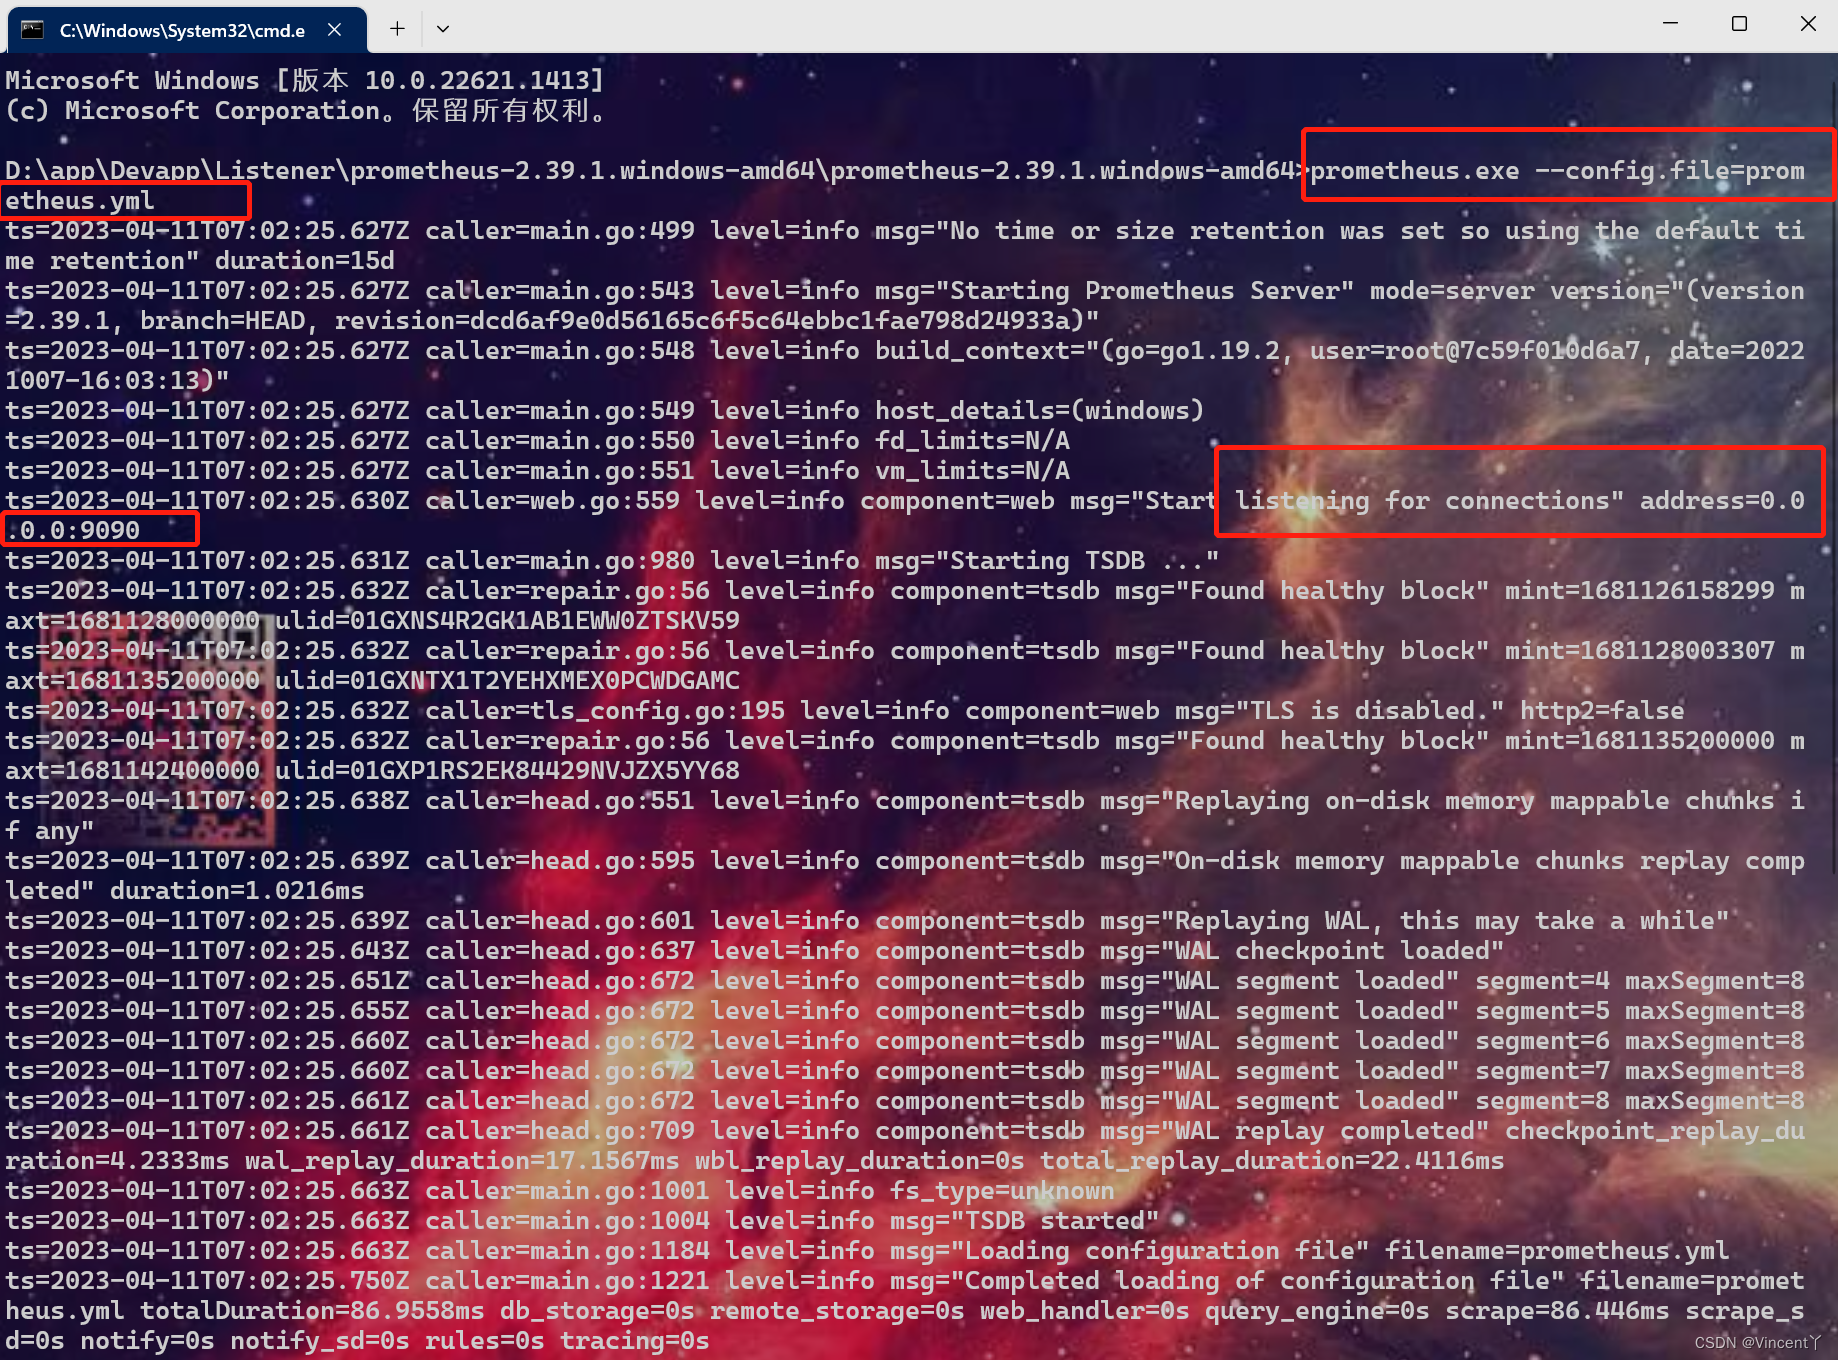
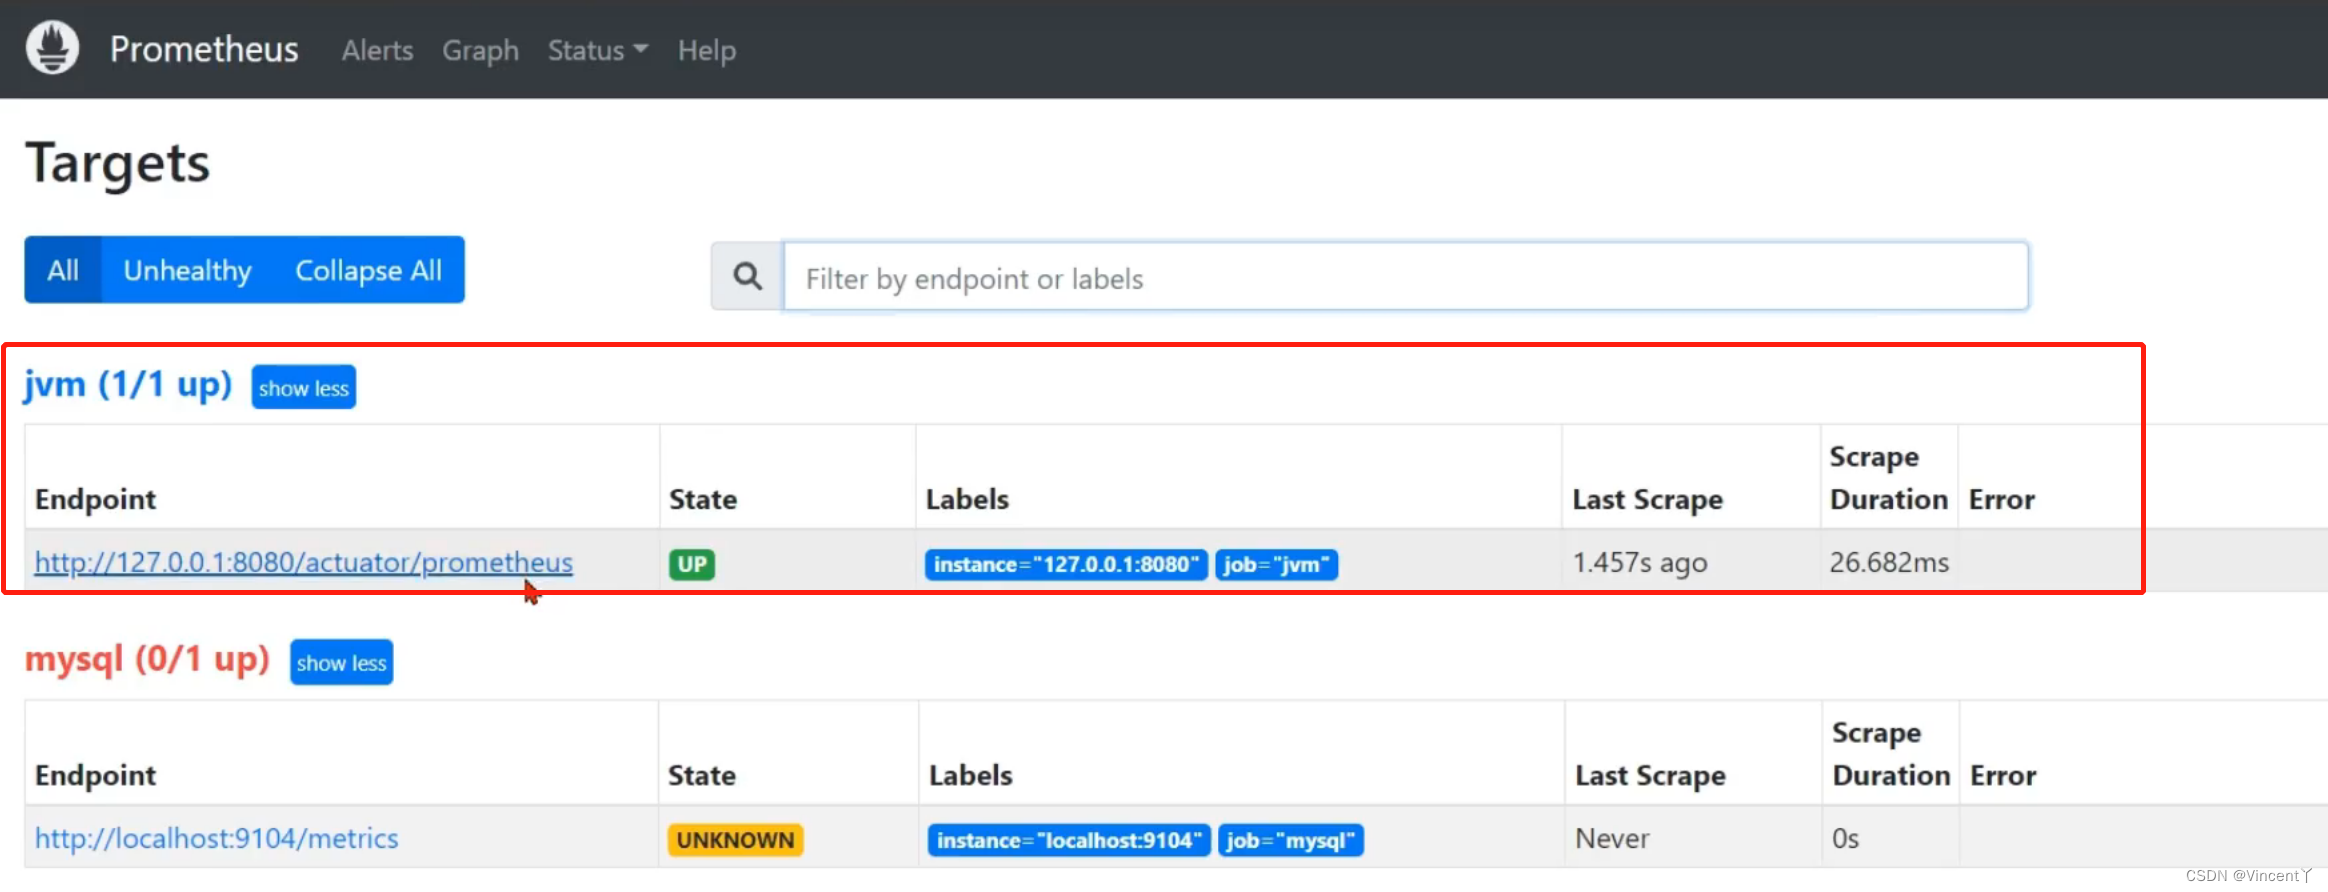
2.2.3 访问地址:http://127.0.0.1:9090/targets
三、配置grafana
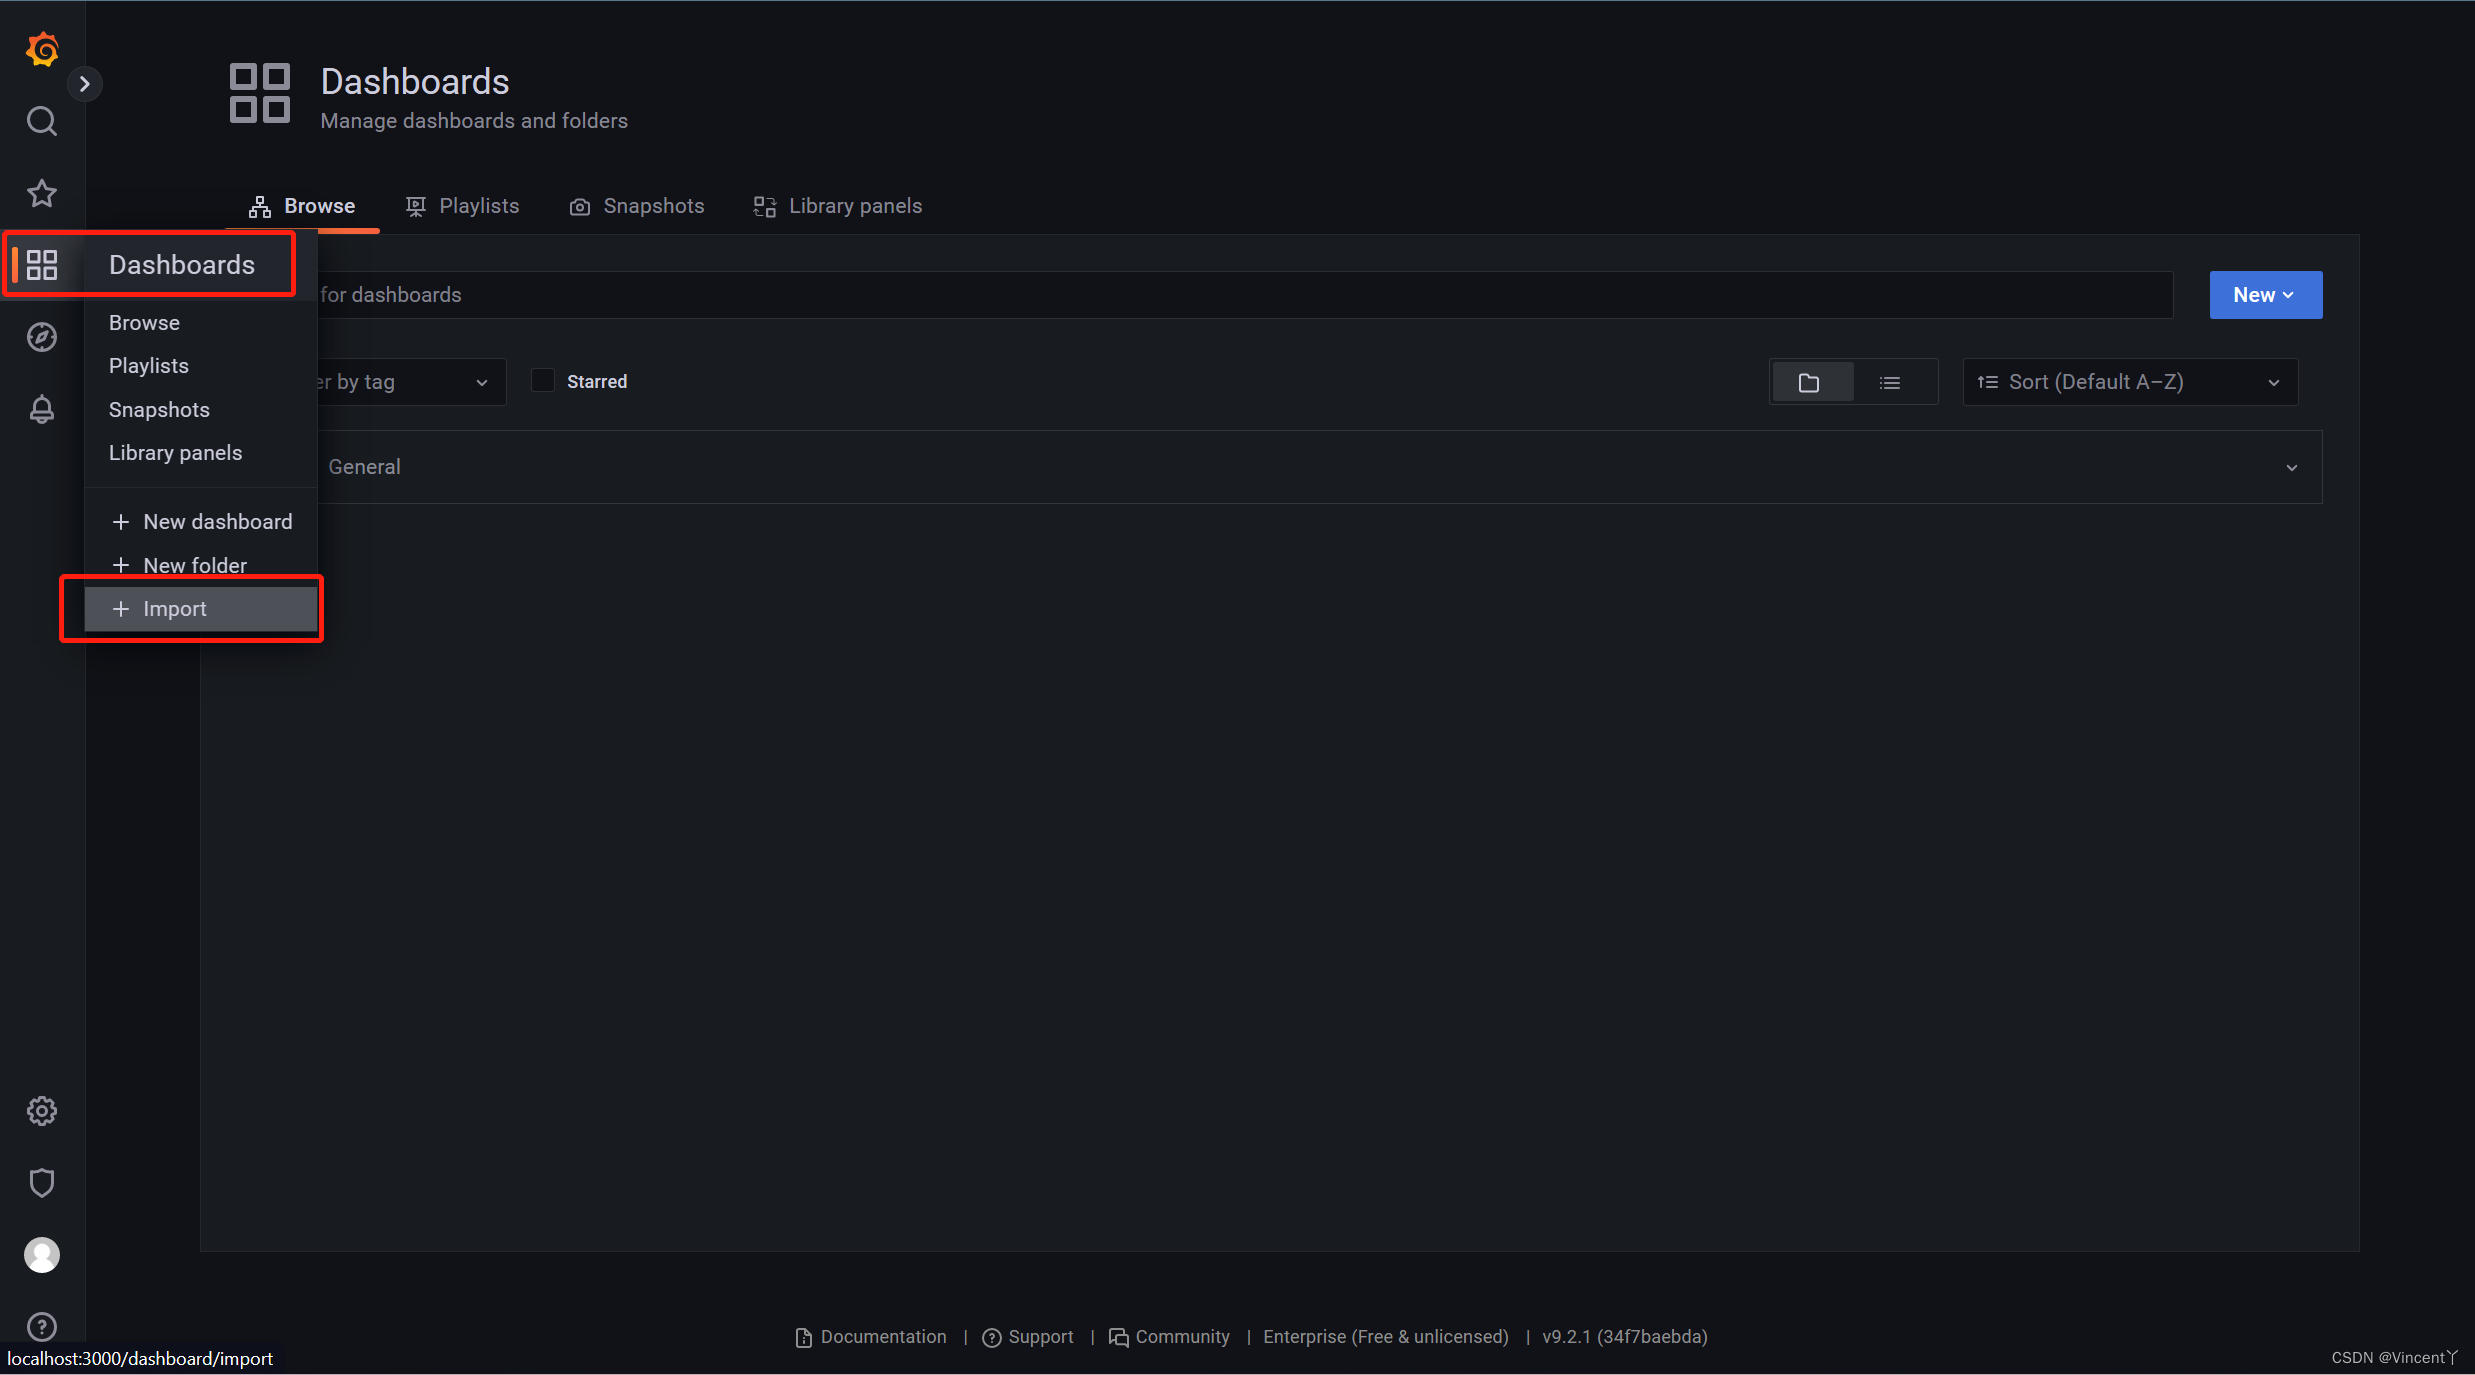
3.1 浏览器输入http://localhost:3000 ,如下图,默认用户名密码 admin/admin

3.2 创建Dashboards
3.3 寻找模板
模板地址:https://grafana.com/grafana/dashboards
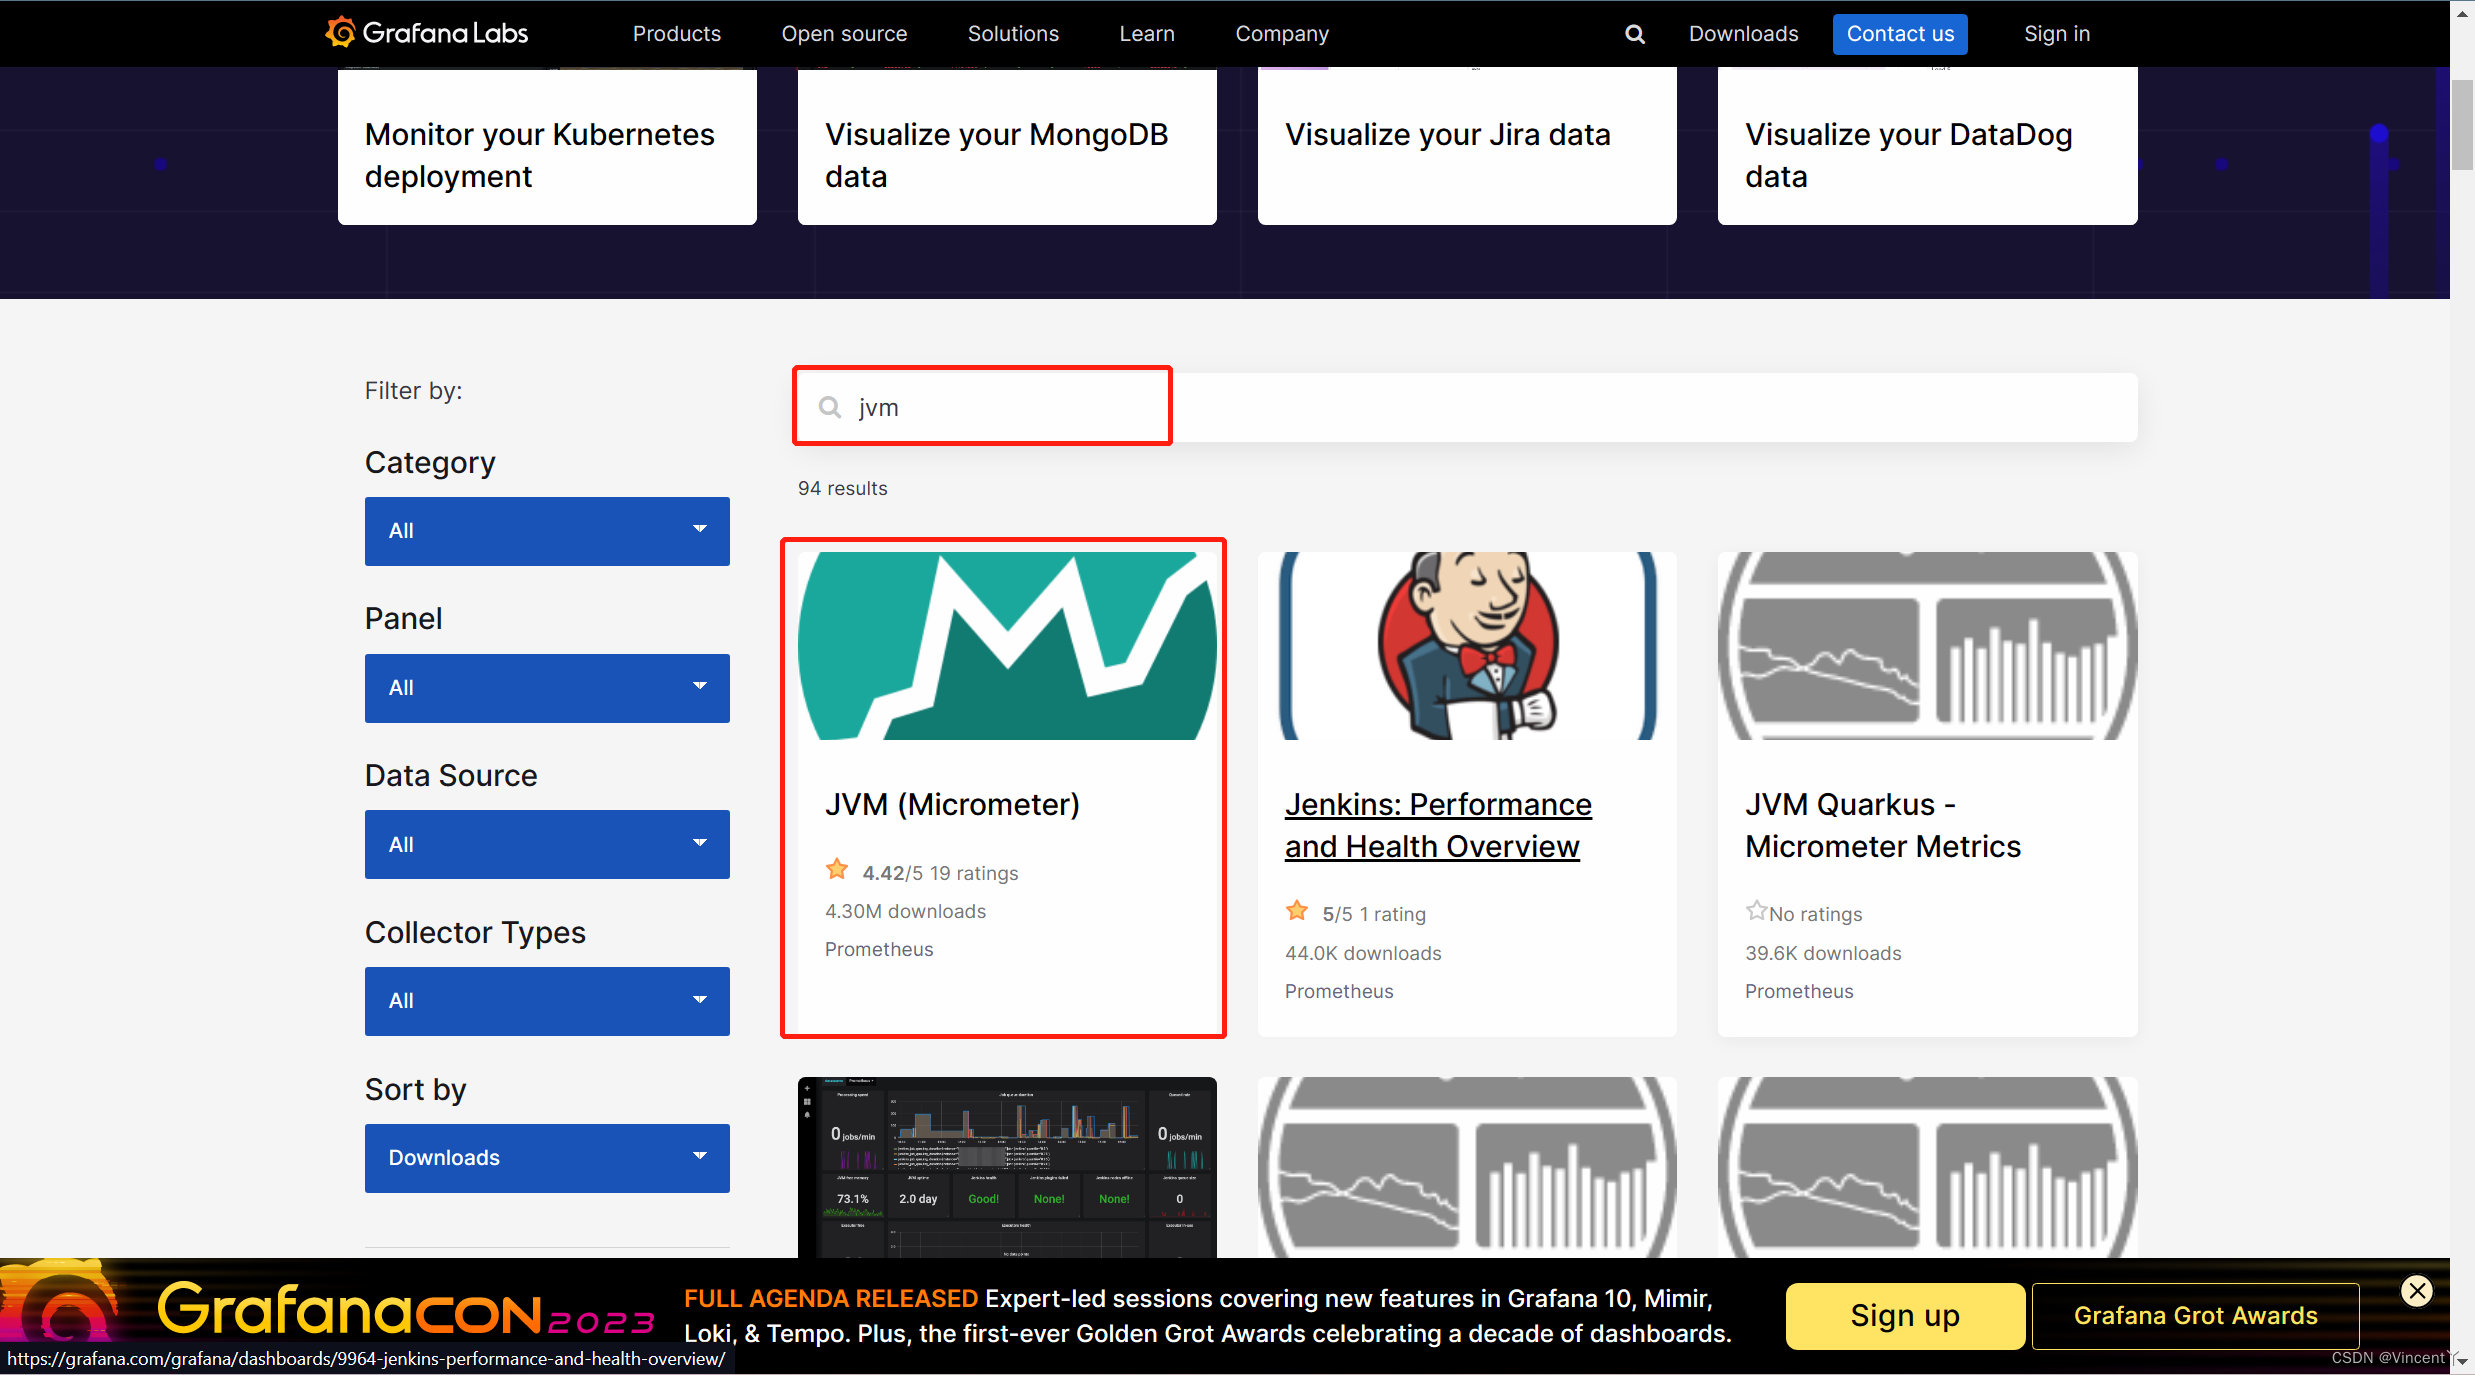
3.4 点击CopyID to clipboard
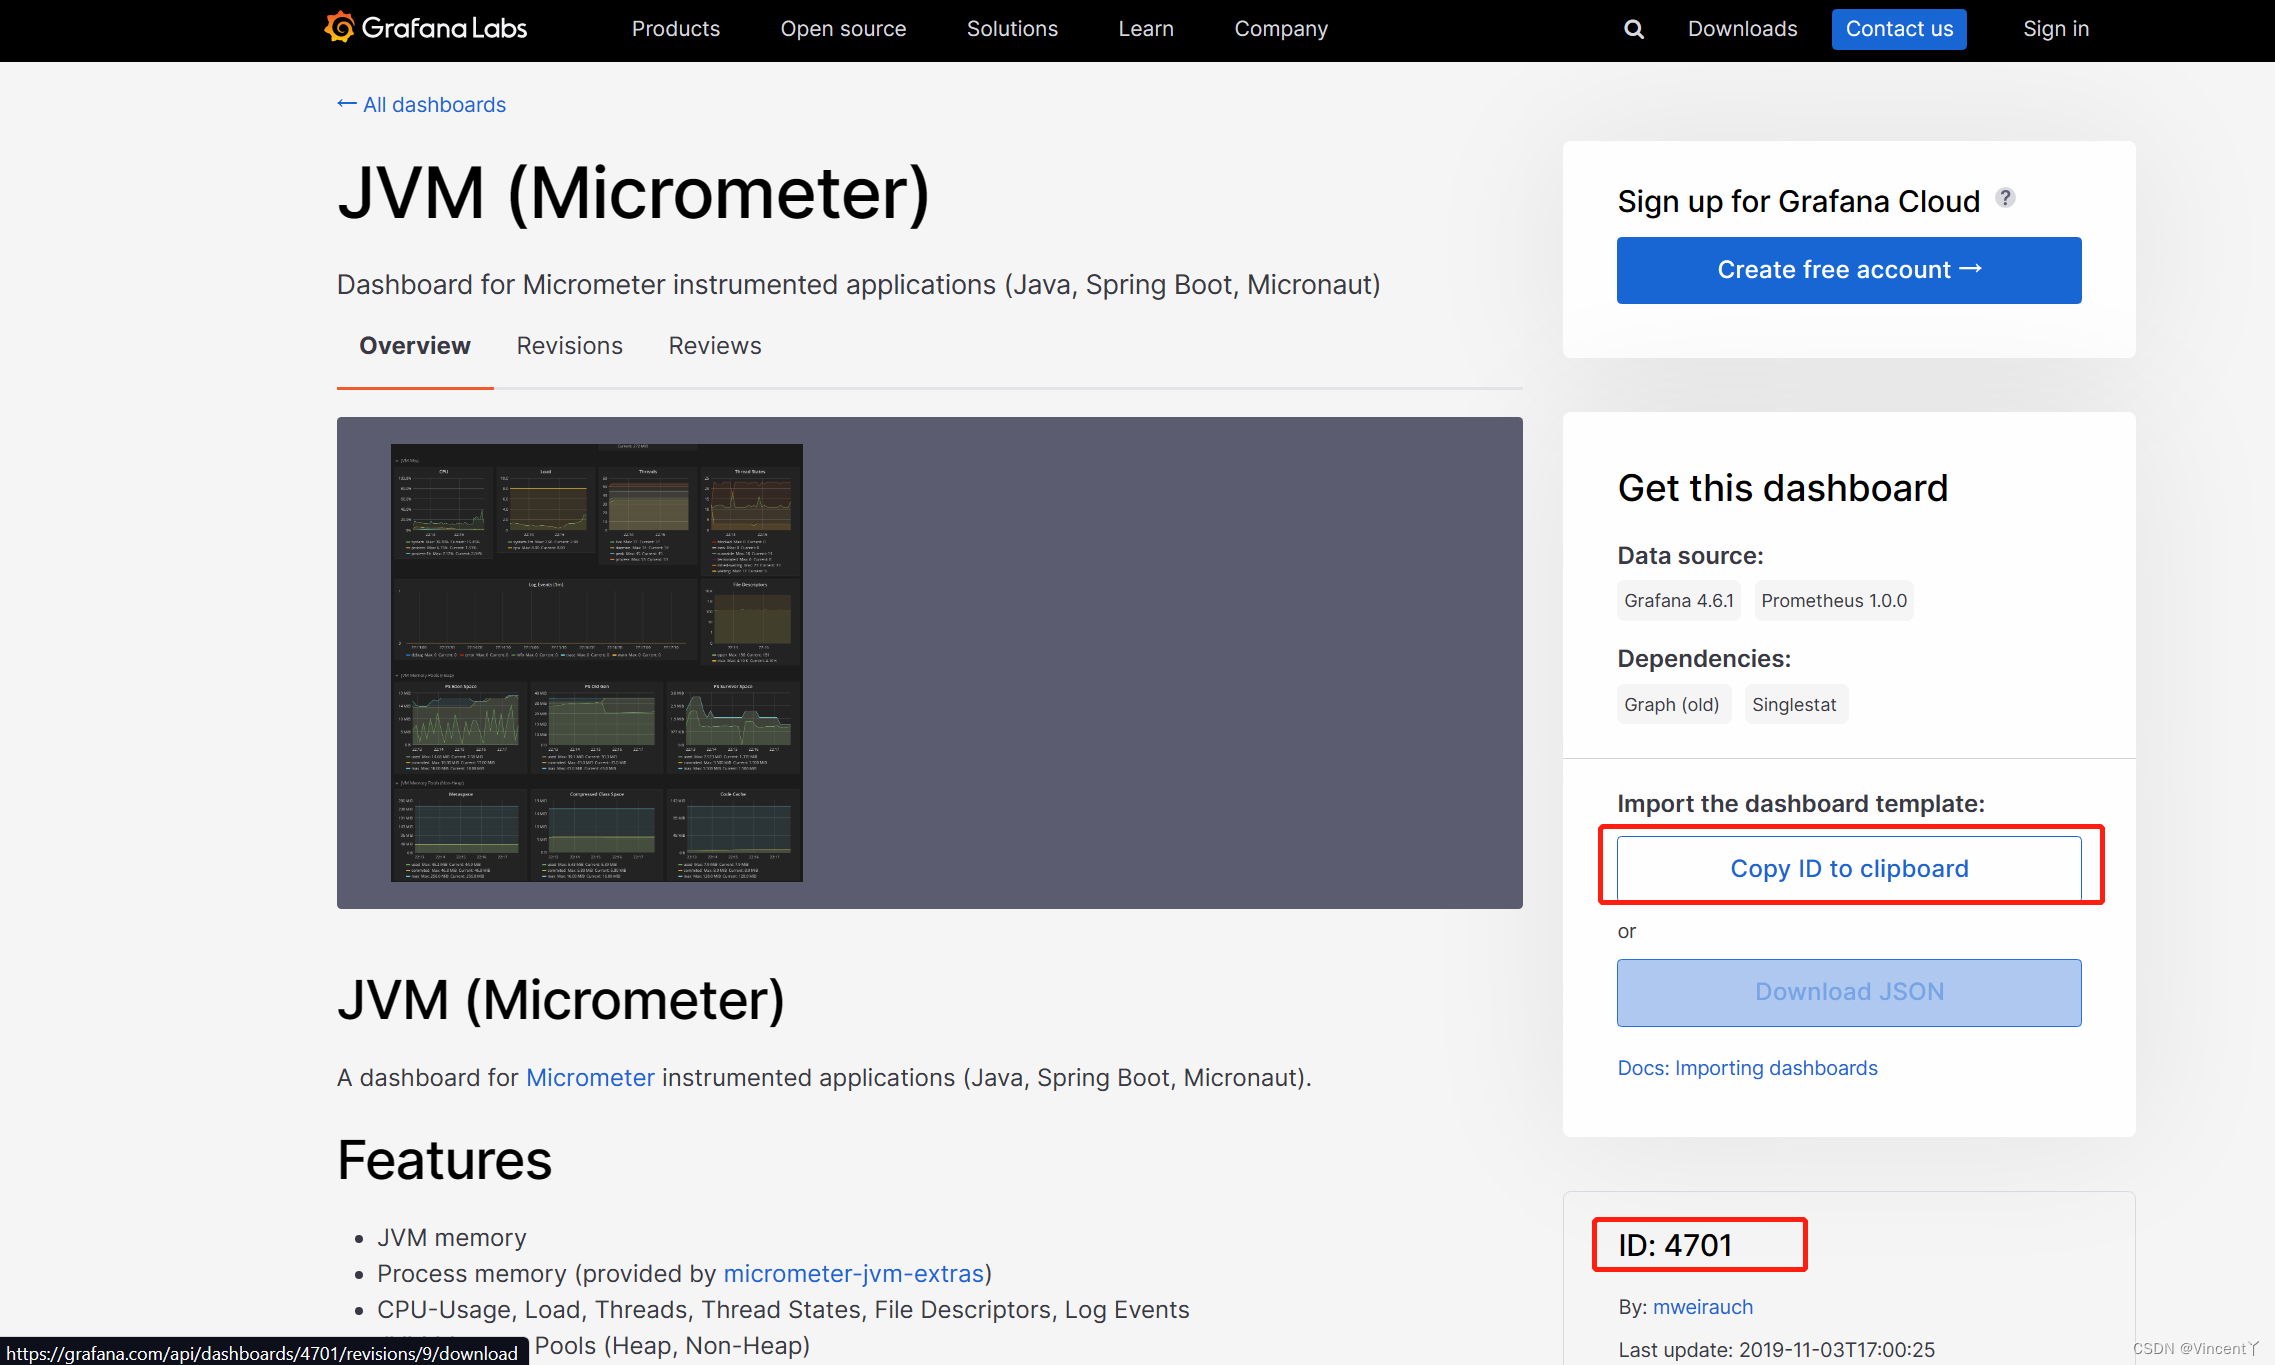
3.5 载入模板(刚才copy的)

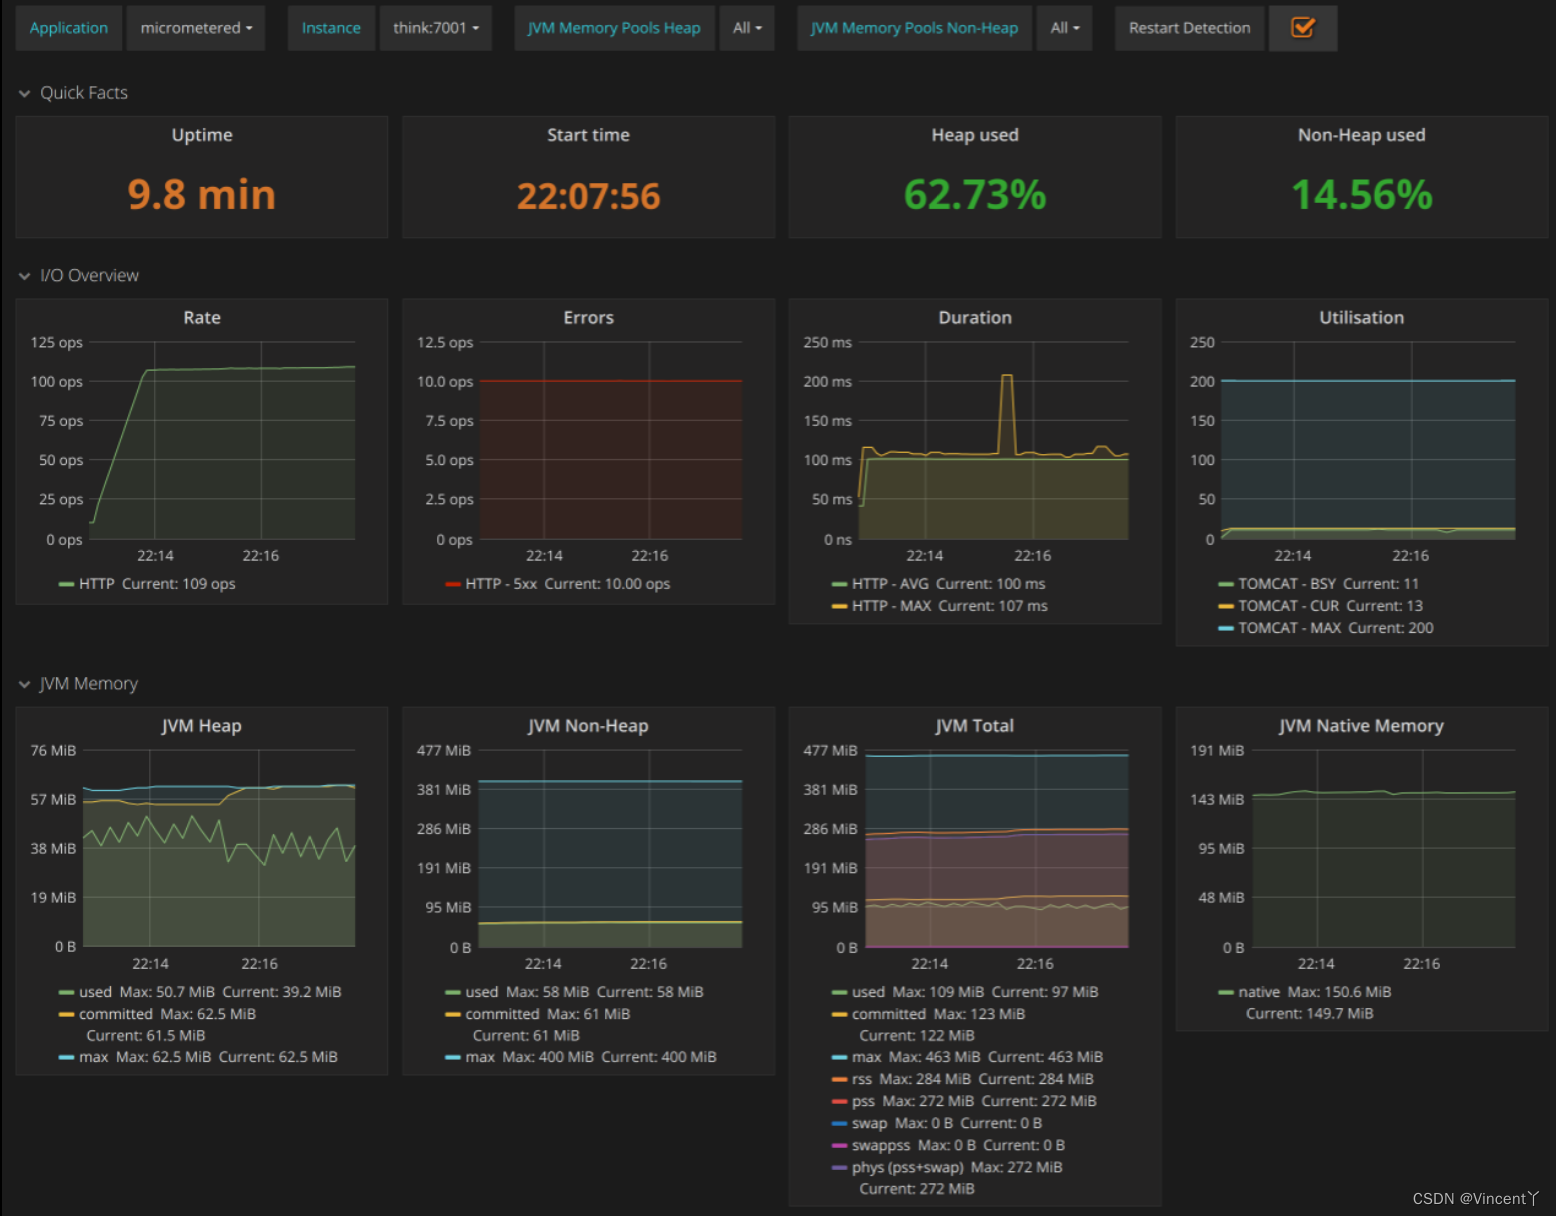
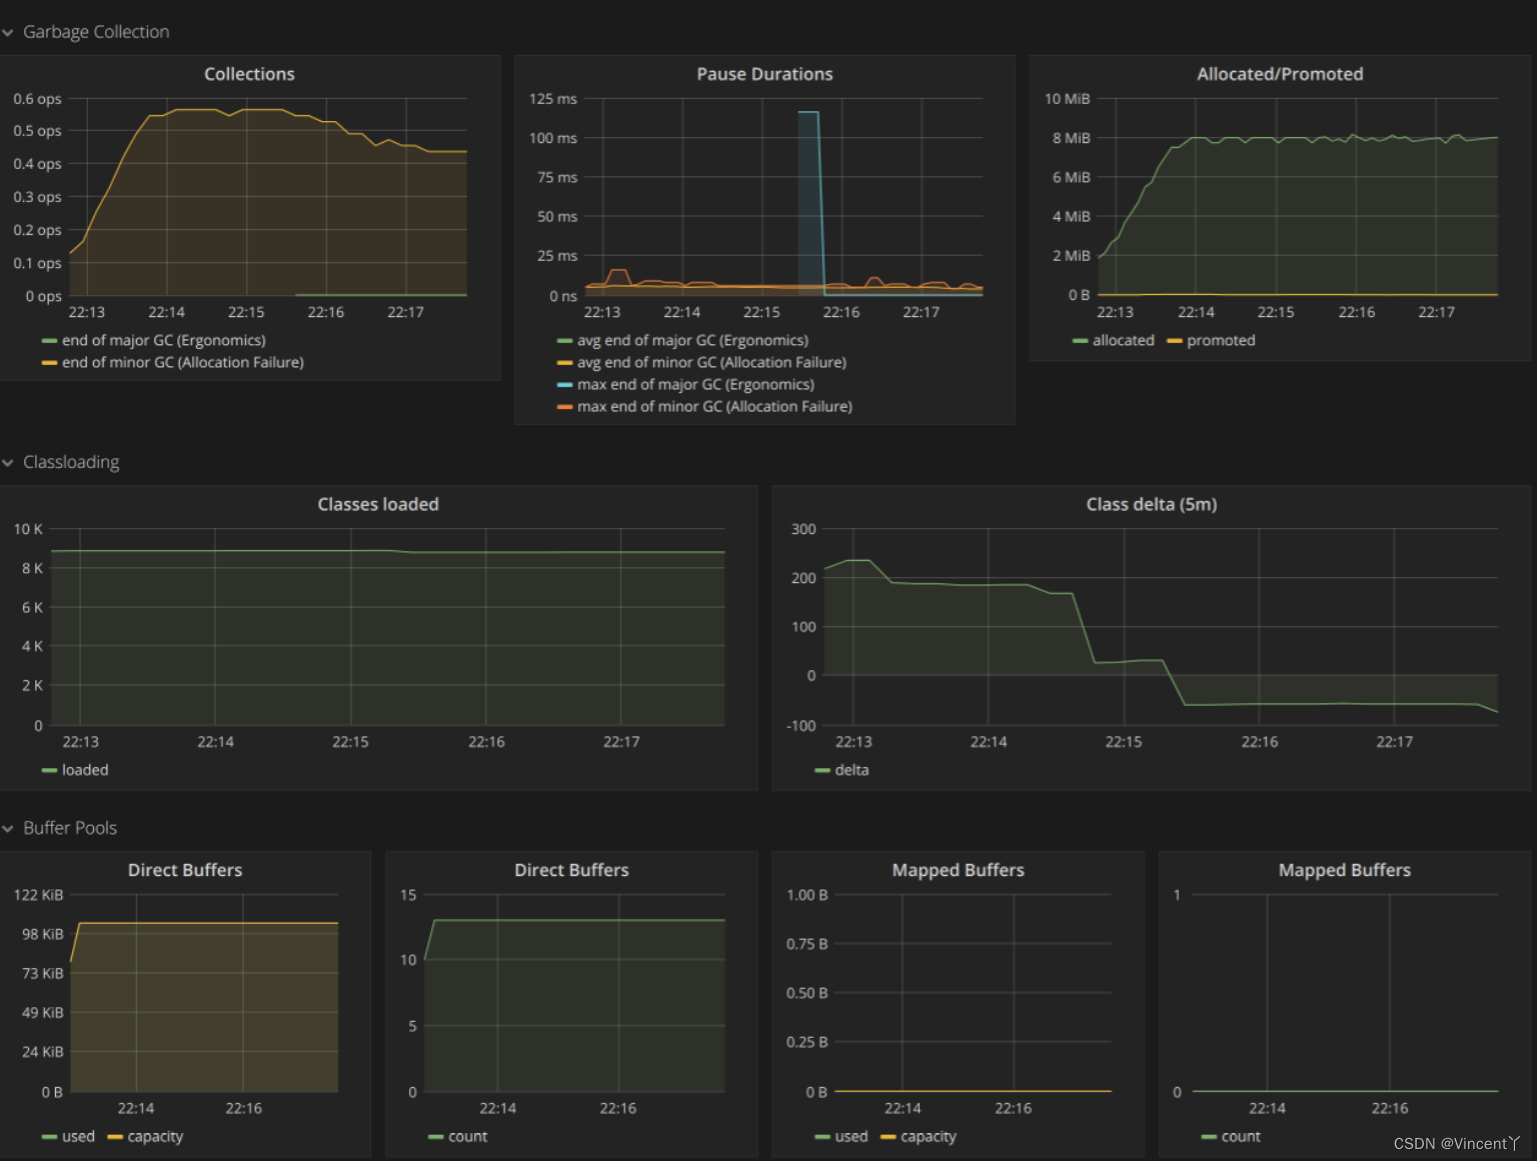
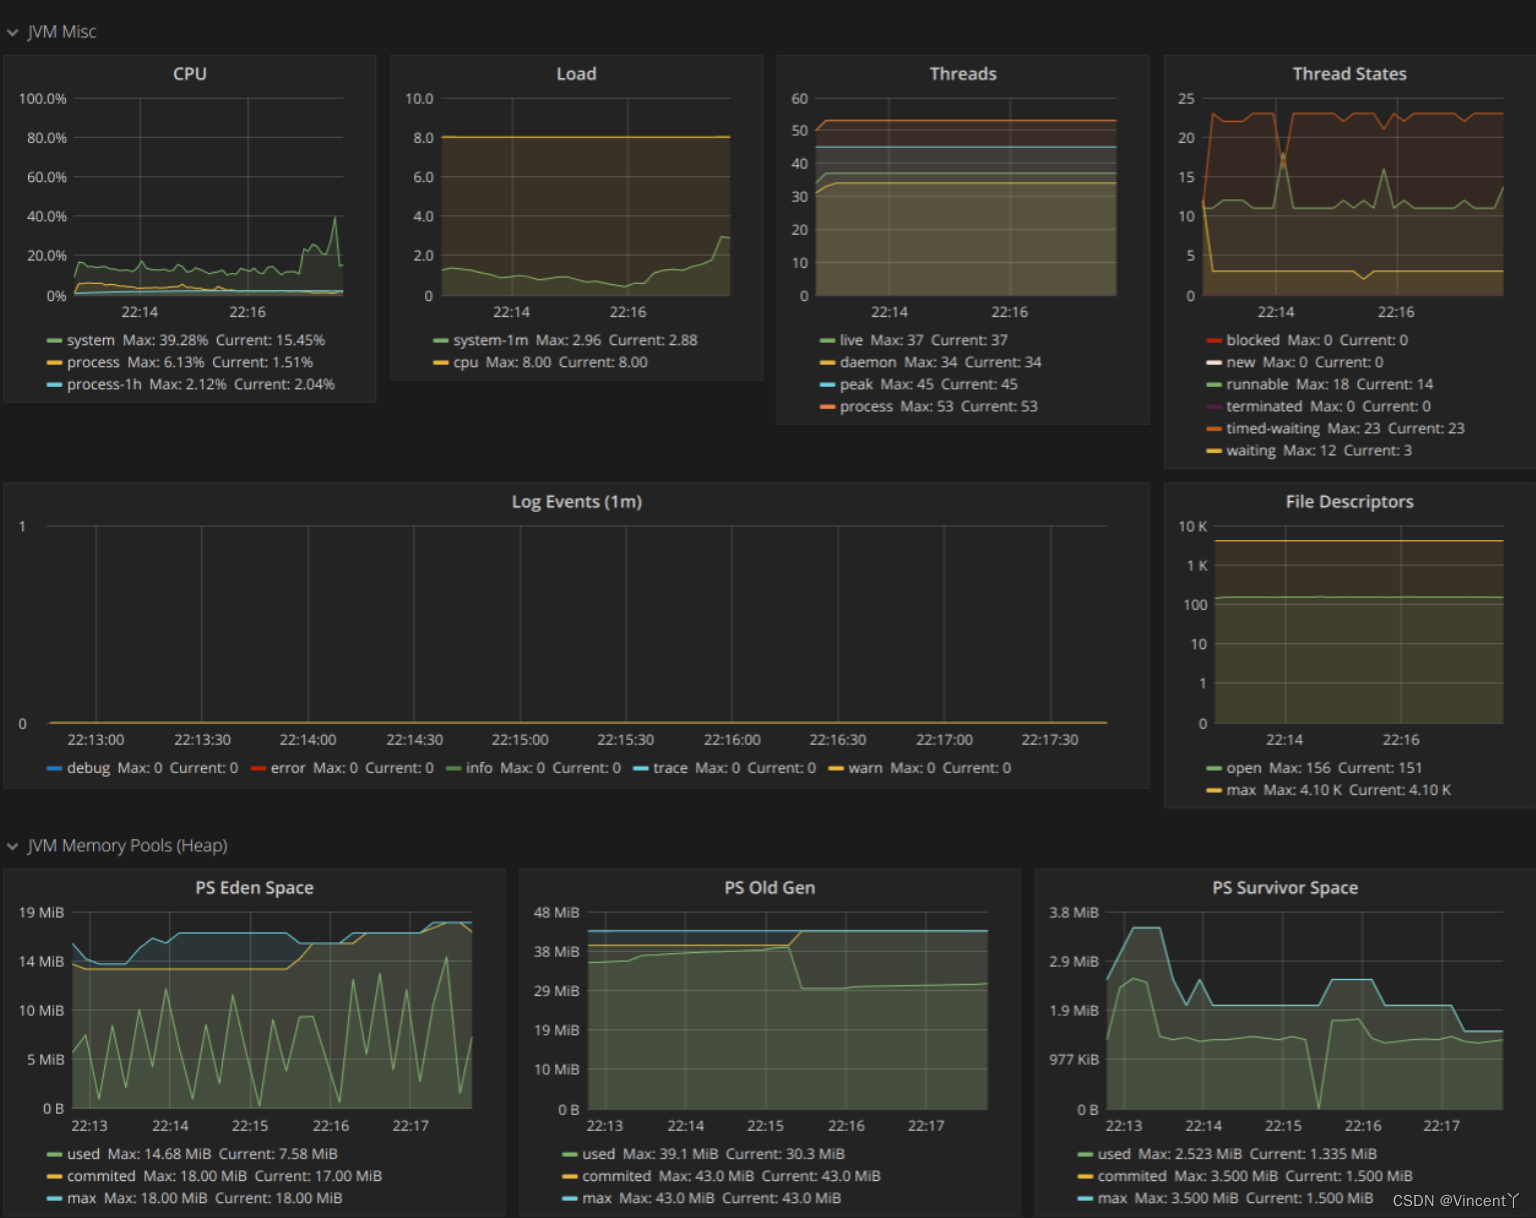
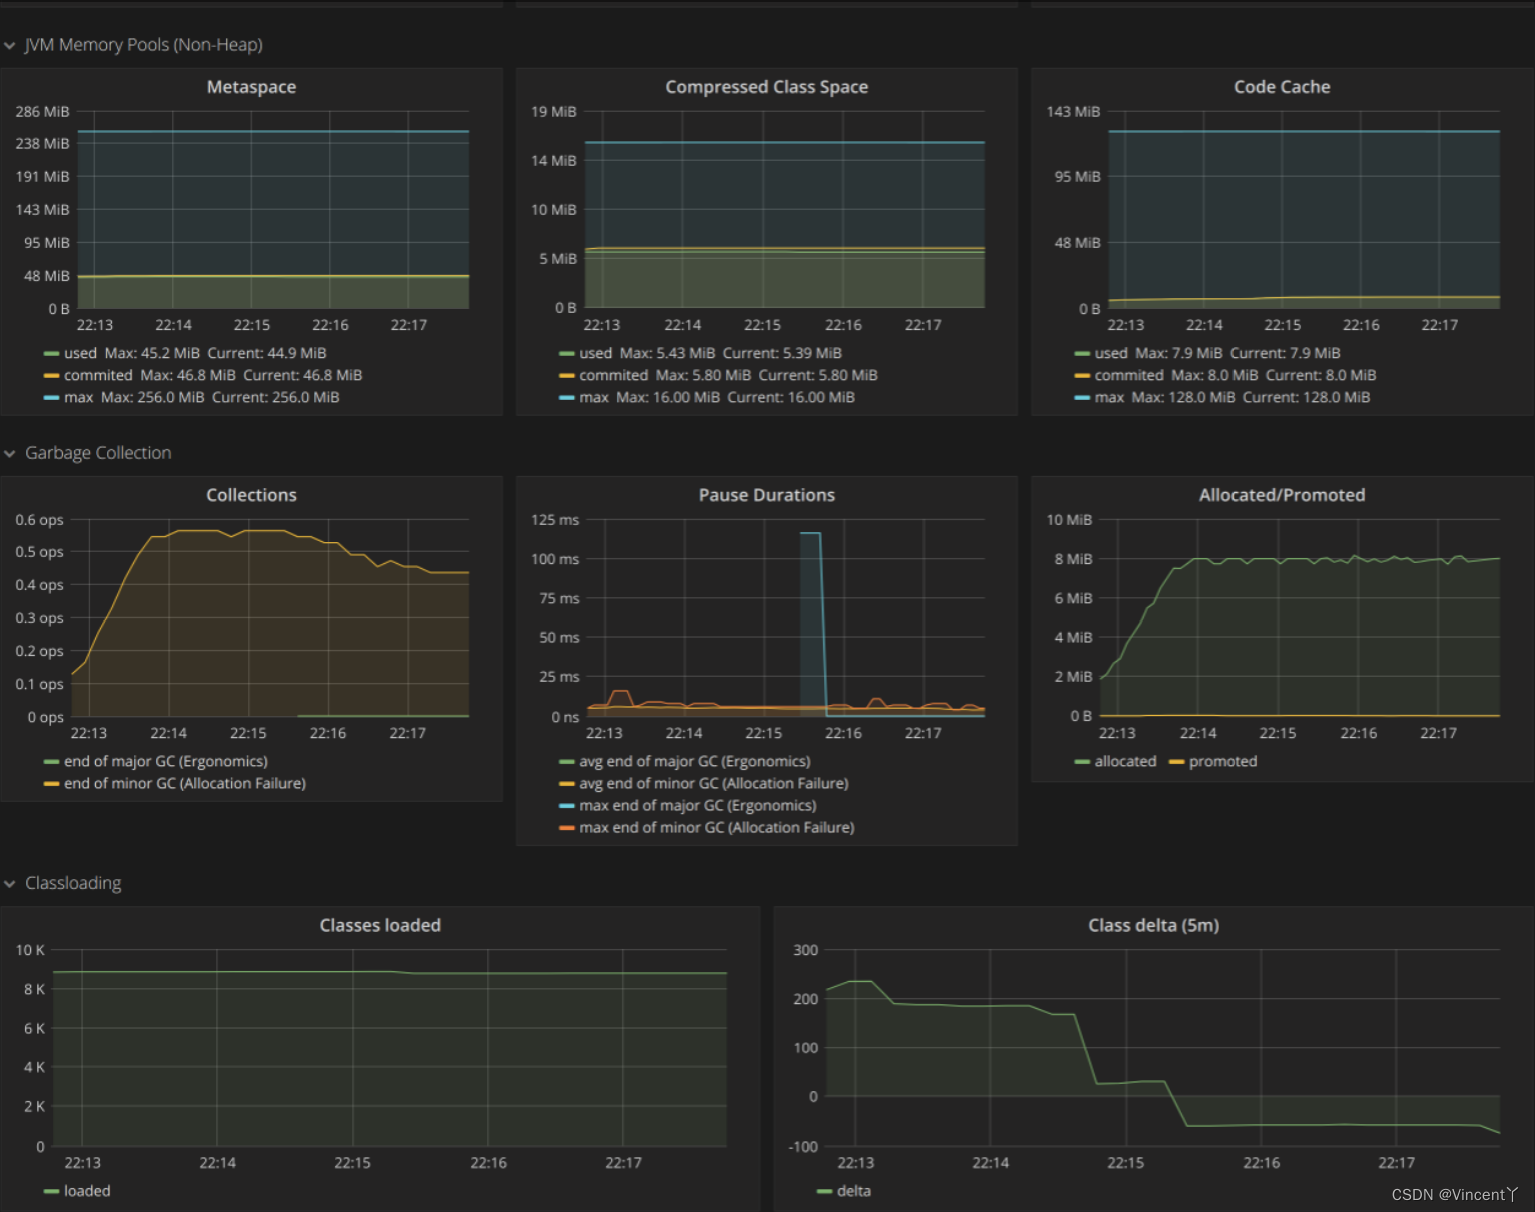
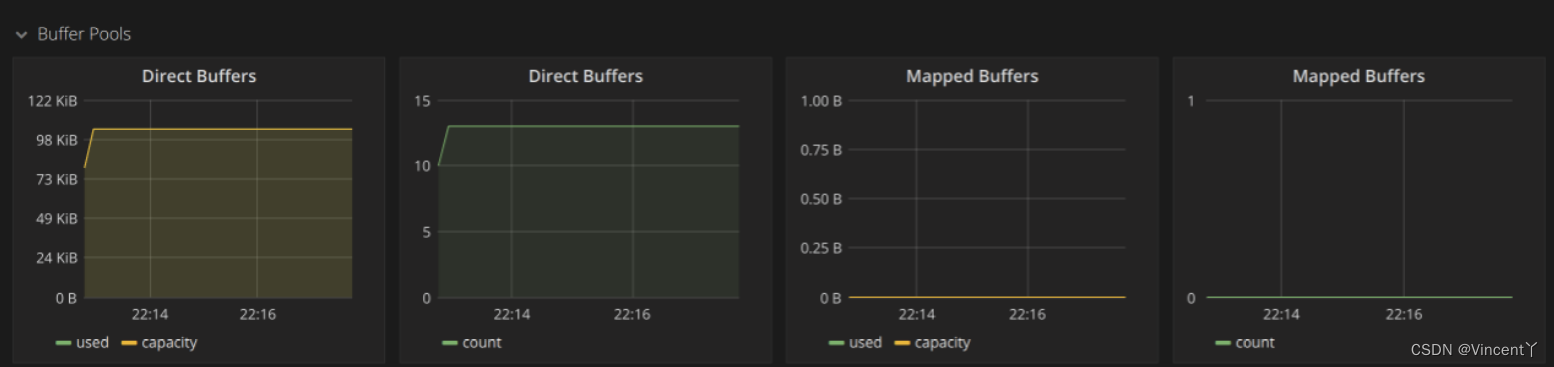
3.6 即可看到相关的数据可视化图表了

想搭建MySQL监控的朋友,可以看我这篇文章,配置、操作步骤非常详细,跟着做就完事了。
5分钟搭建MySQL监控平台(mysql-exporter+Prometheus+Grafana)_Vincent丫的博客-CSDN博客