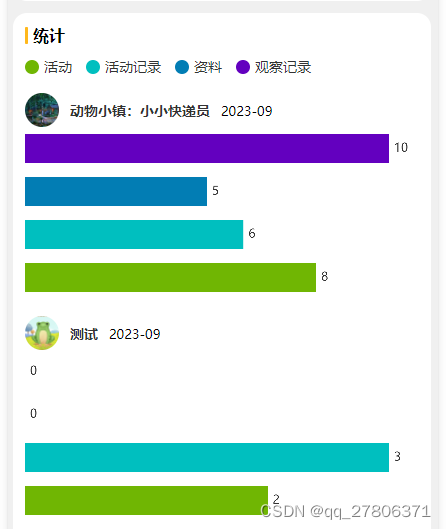
微信小程序 echarts 画多个横向柱状图

然后是json
{
  "usingComponents": {
    "ec-canvas": "../../common/ec-canvas/ec-canvas"
  },
  "navigationBarTitleText": "主题活动"
}
ec-canvas获取方式 在链接里下载代码 然后copy ec-canvas文件夹到自己的项目
//js里引入echarts 在page上面
import * as echarts from '../../common/ec-canvas/echarts'
Page({...})
  getStatisticThemeActivitiesTrend(){
    const that = this
    let oUserInfo = this.data.userInfo
    util.request(api.statisticThemeActivitiesTrend + oUserInfo.userId + '&startDate=' + that.data.startDate + '&endDate=' + that.data.endDate, '', 'get').then(res => {
      if (res.code == 200) {
        let odata = res.data
        this.setData({
          info: odata
        })

        if(!odata.themeList || odata.themeList.length == 0){
          util.alert("暂无数据")
          return
        }

        //主要代码
        odata.themeList.forEach(function (item, index) {
          let echartsComponnet = that.selectComponent('#area-dom-'+index);
          echartsComponnet.init((canvas, width, height, dpr) => {
            // 初始化图表
            const Chart = echarts.init(canvas, null, {
              width: width,
              height: height,
              devicePixelRatio: dpr
            });
            Chart.setOption(that.getAreaPie(item));
            // 注意这里一定要返回 chart 实例,否则会影响事件处理等
            return Chart;
          });
        })
      } else {
        wx.showModal({
          title: res.msg,
          icon: 'error',
          showCancel: false,
          duration: 3000
        });
      }
    });
  },

  getAreaPie(odata) {
    let option = {
      grid: { //图表距边框的距离
        top: 0,
        right: 30,
        bottom: 0,
        left: 0,
        containLabel: false,
      },
      xAxis: {
        type: 'value',
        "splitLine": {     //网格线
          "show": false
        }
      },
      yAxis: {
        show : false,
        type: 'category',
        data: ['','','','']
      },
      series: [
        {
          data: [
            odata.countActivityNumber,
            odata.countPhysicalRecordNumber,
            odata.countDetailNumber,
            odata.countObservationNumber],
          type: 'bar',
          itemStyle: {
            //通常情况下:
            normal:{
              label : {
                show: true,
                position: 'right',
              },
         //每个柱子的颜色即为colorList数组里的每一项,如果柱子数目多于colorList的长度,则柱子颜色循环使用该数组
              color: function (params){
                var colorList = ['#70b603', '#00bfbf', '#027db4', '#6300bf']
                return colorList[params.dataIndex];
              }
            },
            //鼠标悬停时:
            emphasis: {
              shadowBlur: 10,
              shadowOffsetX: 0,
              shadowColor: 'rgba(0, 0, 0, 0.5)'
            },
          },
        }
      ]
    };
    return option
}, https://gitcode.net/mirrors/ecomfe/echarts-for-weixin?utm_source=csdn_github_accelerator&from_codechina=yes