小程序 wxchart 使用简单入门
官方参考:
Example - wxCharts使用说明 · Issue #58 · xiaolin3303/wx-charts · GitHub
引入
地址:GitHub - xiaolin3303/wx-charts: 微信小程序图表charts组件,Charts for WeChat Mini Program
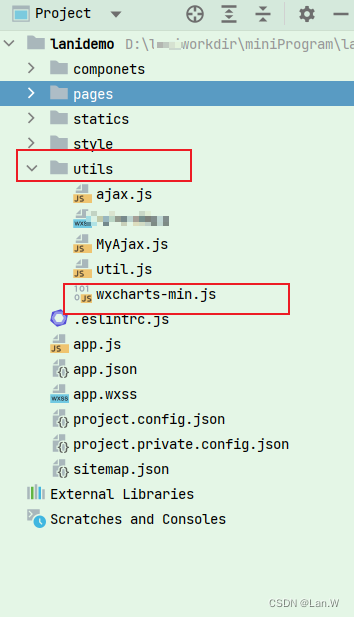
把clone下来的文件里dist下面的wxcharts.js或者wxcharts-min.js放到自己文件目录中
常用参数说明
参数说明
opts Object
opts.canvasId String Required 对应wxml中的canvasId
opts.type String Required 图表类型,可选值为:pie、line、column、area、ring、radar
opts.width Number Required canvas宽度,单位px
opts.height Number Required canvas高度,单位px
opts.legend Boolean 是否显示图表下方各类别的标识,默认true
opts.background String canvas背景颜色 ,默认#fff
opts.animation Boolean 是否动画展示,默认true
opts.enableScroll Boolean 是否开启图表可拖拽滚动,默认false,支持 line、area 图表类型(需配合绑定scrollStart, scroll, scrollEnd 方法)
opts.categories Array Required 数据类别分类 (pie、ring 图表不需要)
opts.dataLabel Boolean 是否在图表中显示数据内容值,默认true
opts.dataPointShare Boolean 是否在图表中显示数据点图形标识,默认true
opts.xAxis Object X轴配置
opts.xAxis.gridColor String X轴网格颜色
opts.xAxis.fontColor String X轴数据点颜色
opts.xAxis.disableGrid Boolean 不绘制X轴网格,默认false
opts.xAxis.type String 可选值:calibration(刻度),默认包含样式
opts.yAxis Object Y轴配置
opts.yAxis.format Function 自定义Y轴文案显示
opts.yAxis.min Number Y轴起始值
opts.yAxis.max Number Y轴终止值
opts.yAxis.title String Y轴title
opts.yAxis.gridColor String Y轴网格颜色
opts.yAxis.fontColor String Y轴数据点颜色
opts.yAxis.titleFontColor String Y轴title颜色
opts.yAxis.disabled Boolean 不绘制Y轴,默认false
opts.extra Object 其它非通用配置项
opts.extra.ringWidth Number ring圆环宽度,单位px
opts.extra.lineStyle String 仅对line、area图表有效,可选值:curve曲线、straight直线,默认straight
opts.extra.column Object column图表相关配置
opts.extra.column.width Number 柱状图每项的图形宽度,单位px
opts.extra.legendTextColor String legend文案颜色
opts.series Array Required 数据列表
数据列表series每项参数说明dataItem Object
dataItem.data Array Required 饼图、圆环图为Number数据,如果传入null,图表该处出现断点
dataItem.color String 不传入则使用系统默认的配色方案
dataItem.name String 数据名称
dataItem.format Function 自定义显示数据内容
ring 图表相关配置opts.title Object 仅支持 ring 图表类型
opts.title.name String 标题内容
opts.title.fontSize Number 标题字体大小,单位px
opts.title.color String 标题颜色
opts.title.offsetX Number 标题横向位置偏移量,单位px,默认0
opts.subtitle Object 仅支持 ring 图表类型
opts.subtitle.name String 副标题内容
opts.subtitle.fontSize Number 副标题字体大小,单位px
opts.subtitle.color String 副标题颜色
opts.subtitle.offsetX Number 副标题横向位置偏移量,单位px,默认0
radar 图表相关配置opts.extra.radar Object radar图表相关配置
opts.extra.radar.max Number 数据区间最大值,用于调整数据显示的比例,默认series data的最大值
opts.extra.radar.labelColor String 各项标识文案的颜色,默认#666
opts.extra.radar.gridColor String 雷达图网格颜色,默认#cccpie、ring 图表相关配置
opts.disablePieStroke Boolean 不绘制pie、ring图表各区块的白色分割线,默认false
opts.extra.pie Object pie、ring图表相关配置
opts.extra.pie.offsetAngle Number 起始角度偏移度数,顺时针方向,起点为3点钟位置(比如要设置起点为12点钟位置,即逆时针偏移90度,传入-90即可),默认0
type:'pie',设置类型简单,改掉初始时type的值就可以了
pie
ring
line
column
area
radar
1.饼图 pie
2.圆环图 ring
3.线图 line
4.柱状图 column
5.区域图 area
6.雷达图 radar
实例
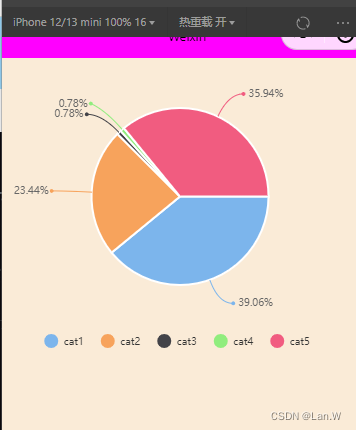
饼图 type:'pie'
//wxml
<canvas class="cav" canvas-id="pieCanvas"></canvas>

//js
Page({
  data: {
    chart: null
  },
  onLoad: function (options) {
    var wxCharts = require('../../utils/wxcharts-min.js');
    let chart = new wxCharts({
      canvasId: 'pieCanvas',
      type: 'pie',
      series: [{
        name: 'cat1',
        data: 50,
      }, {
        name: 'cat2',
        data: 30,
      }, {
        name: 'cat3',
        data: 1,
      }, {
        name: 'cat4',
        data: 1,
      }, {
        name: 'cat5',
        data: 46,
      }],
      width: 360,
      height: 300,
      dataLabel: true
    });
    this.setData({
      chart: chart,
    })
  }
});

//wxss

.cav{
  width: 100%;
  height: 540px;
  background-color: antiquewhite;
}
饼图效果
圆环
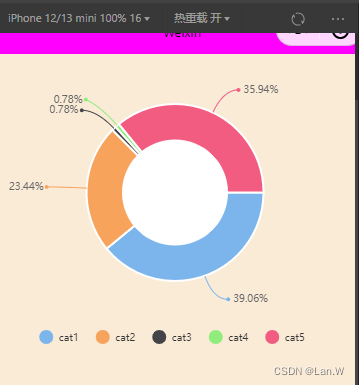
有了饼的经验,这个简单了。把type:'pie'改成 type:'ring'
//wxml
<canvas class="cav" canvas-id="pieCanvas"></canvas>

//js
Page({
  data: {
    chart: null
  },
  onLoad: function (options) {
    var wxCharts = require('../../utils/wxcharts-min.js');
    let chart = new wxCharts({
      canvasId: 'pieCanvas',
      type: 'ring',
      series: [{
        name: 'cat1',
        data: 50,
      }, {
        name: 'cat2',
        data: 30,
      }, {
        name: 'cat3',
        data: 1,
      }, {
        name: 'cat4',
        data: 1,
      }, {
        name: 'cat5',
        data: 46,
      }],
      width: 360,
      height: 300,
      dataLabel: true
    });
    this.setData({
      chart: chart,
    })
  }
});

//wxss

.cav{
  width: 100%;
  height: 540px;
  background-color: antiquewhite;
}
圆环效果图
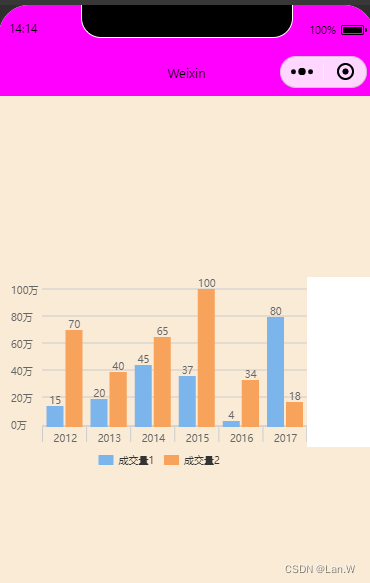
柱状图:
//wxss
.cav{
    width: 100%;
    height: 540px;
    background-color: antiquewhite;
}

//wxml
<canvas class="cav" canvas-id="column"></canvas>

js
Page({
  data: {
    colChart: null,
  },
  onLoad: function (options) {
    var wxCharts = require('../../utils/wxcharts-min.js');

    let col = new wxCharts({
      canvasId: 'column',
      type: 'column',
      categories: ['2012', '2013', '2014', '2015', '2016', '2017'],
      series: [{
        name: '成交量1',
        data: [15, 20, 45, 37, 4, 80]
      }, {
        name: '成交量2',
        data: [70, 40, 65, 100, 34, 18]
      }],
      yAxis: {
        format: function (val) {
          return val + '万';
        }
      },
      width: 320,
      height: 200
    });

    this.setData({
      colChart: col
    })
  }
});
line 线条
效果:
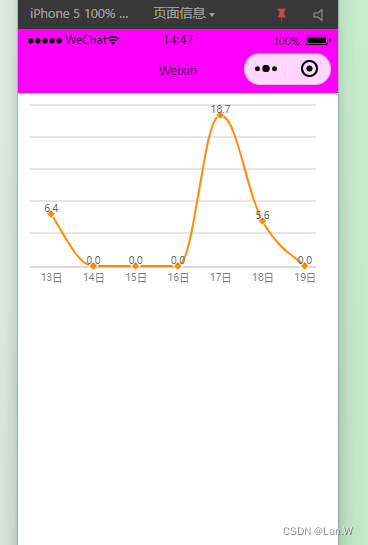
案例源码:
//wxml
<view>
  <canvas canvas-id="linec" class="chart"> </canvas>
</view>

//wxss
.chart {
  width: 700rpx;
  height: 600rpx;
}

//js
const wxCharts = require("../../../utils/wxcharts.js")

let areaChart;
Page({
  LoadTu() {
    areaChart = new wxCharts({
      canvasId: 'linec', type: 'line',
      categories: this.data.chartDatas.day7,
      animation: true,
      series: [{
        name: '洗涤费',
        // 线条的颜色
        color: '#FF8A06',
        data: this.data.chartDatas.money7,
        format: function (val) {
          return val.toFixed(1) + '';
        }
      }],
      dataPointShape: true,
      xAxis: {
        fontColor: '#7D7D7F',
        // 不显示x轴 刻度点
        disableGrid: true,
      },
      yAxis: {
        // y轴文字颜色,display:true不显示
        fontColor: '#FF8A06',
        // 不显示y轴
        disabled: true
      },
      // 非通用配置
      extra: {
        legendTextColor: '#c427b1',
        lineWidth: 10,
        // 线条形状:curve 圆滑
        lineStyle: 'curve'
      },
      // dataPointShape:false,
      legend: false,
      width: 320, height: 200,
    });

    return this;
  },

  data: {
    menus: [],
    ordermsg: {},
    swiper_h: 0,
    chartDatas: {
      money7: [6.4, 0, 0, 0, 18.71, 5.6, 0],
      day7: ["13日", "14日", "15日", "16日", "17日", "18日", "19日"]
    }
  },
  onLoad: function (options) {
    this.LoadTu()
  }
});