m_map绘图添加遥感图片
在matlab下的m_map可以绘制地形图。那么,如何在m_map添加卫星遥感图片呢?这需要使用m_image函数。
基本语法为:
m_image(lonlim,latlim,c)
其中lonlim和latlim是这个图像地理坐标(经纬度)的边界,是一个长度为2的数组。c是图像数组,大小为mn3,其中m,n表示图像的行列数,3表示RGB参数。
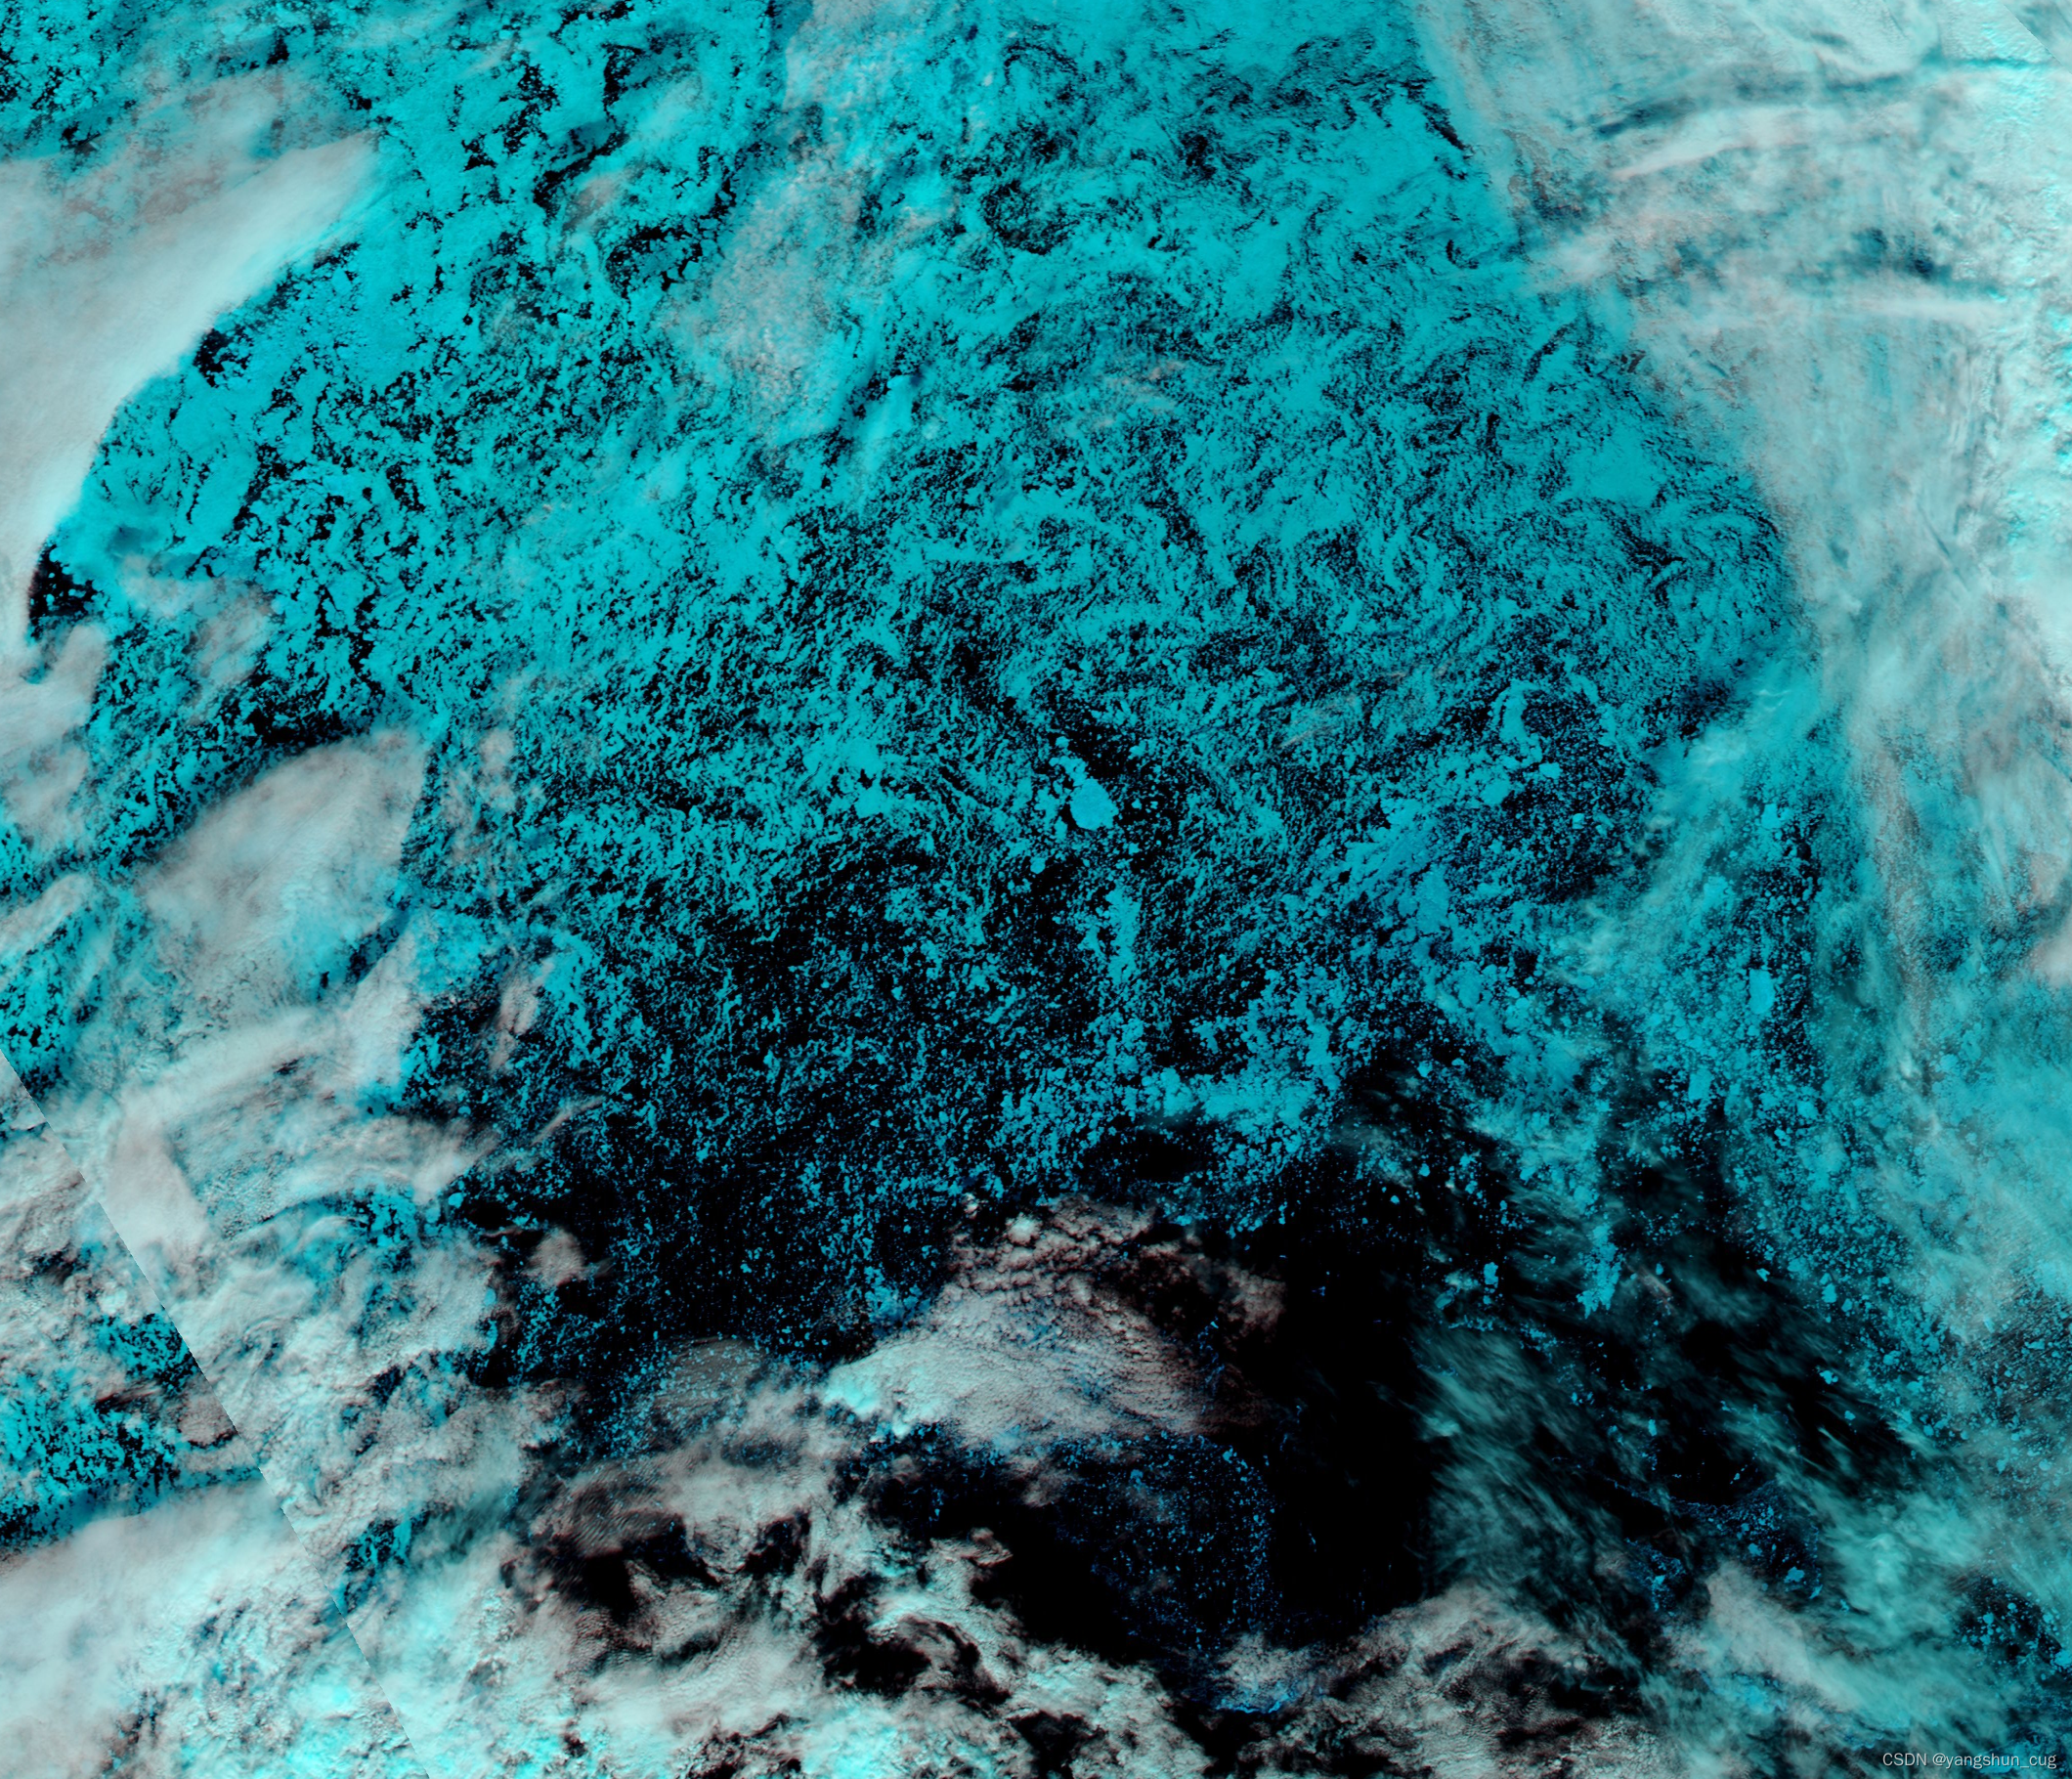
现在有以下图像,来自MODIS的Aqua传感器,拍摄时间为2011-08-01,位置为73-77°N,174-156°W。位置大致为北冰洋楚科奇海域。其中:蓝色为海冰,白色为云层,黑色为海水。
figname='snapshot-2011-08-04-map';
figfile='snapshot-2011-08-04.png';
% 读取遥感图像数据
figdata=imread(figfile);
% 显示遥感图像
figure
imshow(figdata)
figure
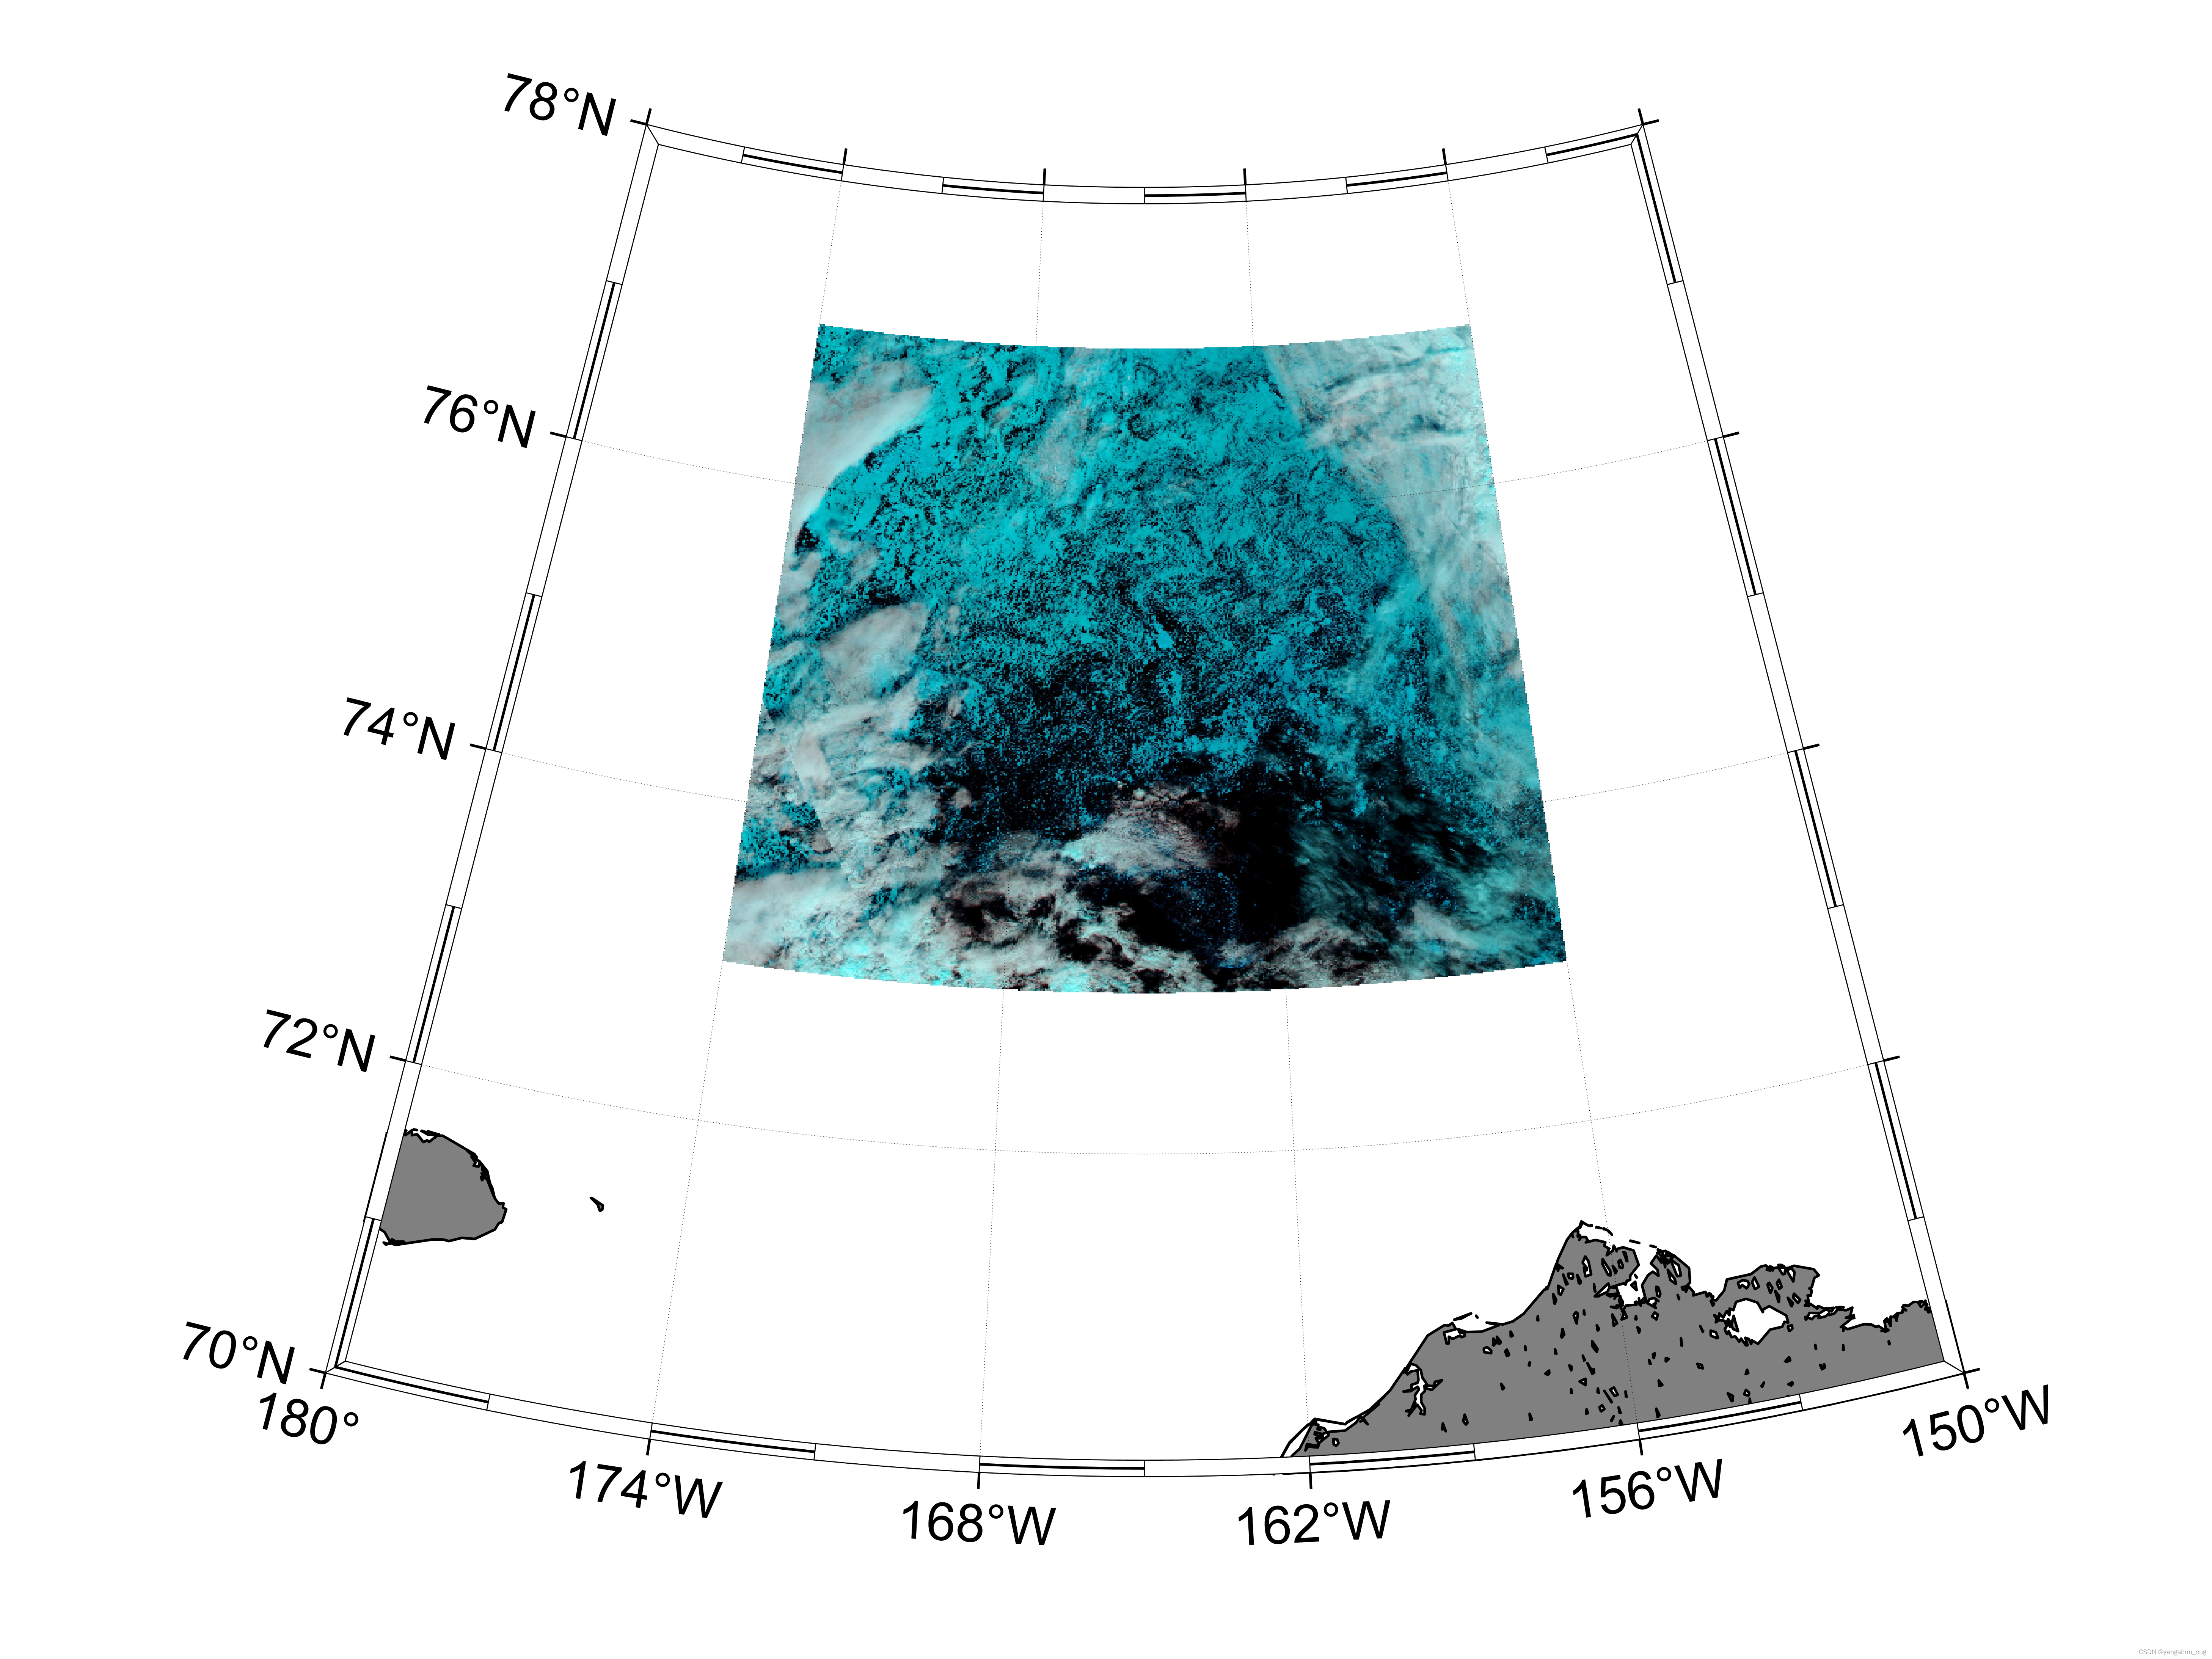
% 使用lambert投影,图框经纬度范围为180-150°W,70-78°N
m_proj('lambert','long',[-180 -150],'lat',[70 78]);
hold on
% 插入遥感图,注意遥感图的纬度顺序要颠倒
m_image([-174 -156],[77 73],figdata),hold on
% 填充陆地
m_gshhs('ic','patch',[1 1 1]*0.5)
m_grid('box','fancy','tickdir','out')
print('-dpng','-r1000',[figname,'.png']) % 导出png图片
图像如下:
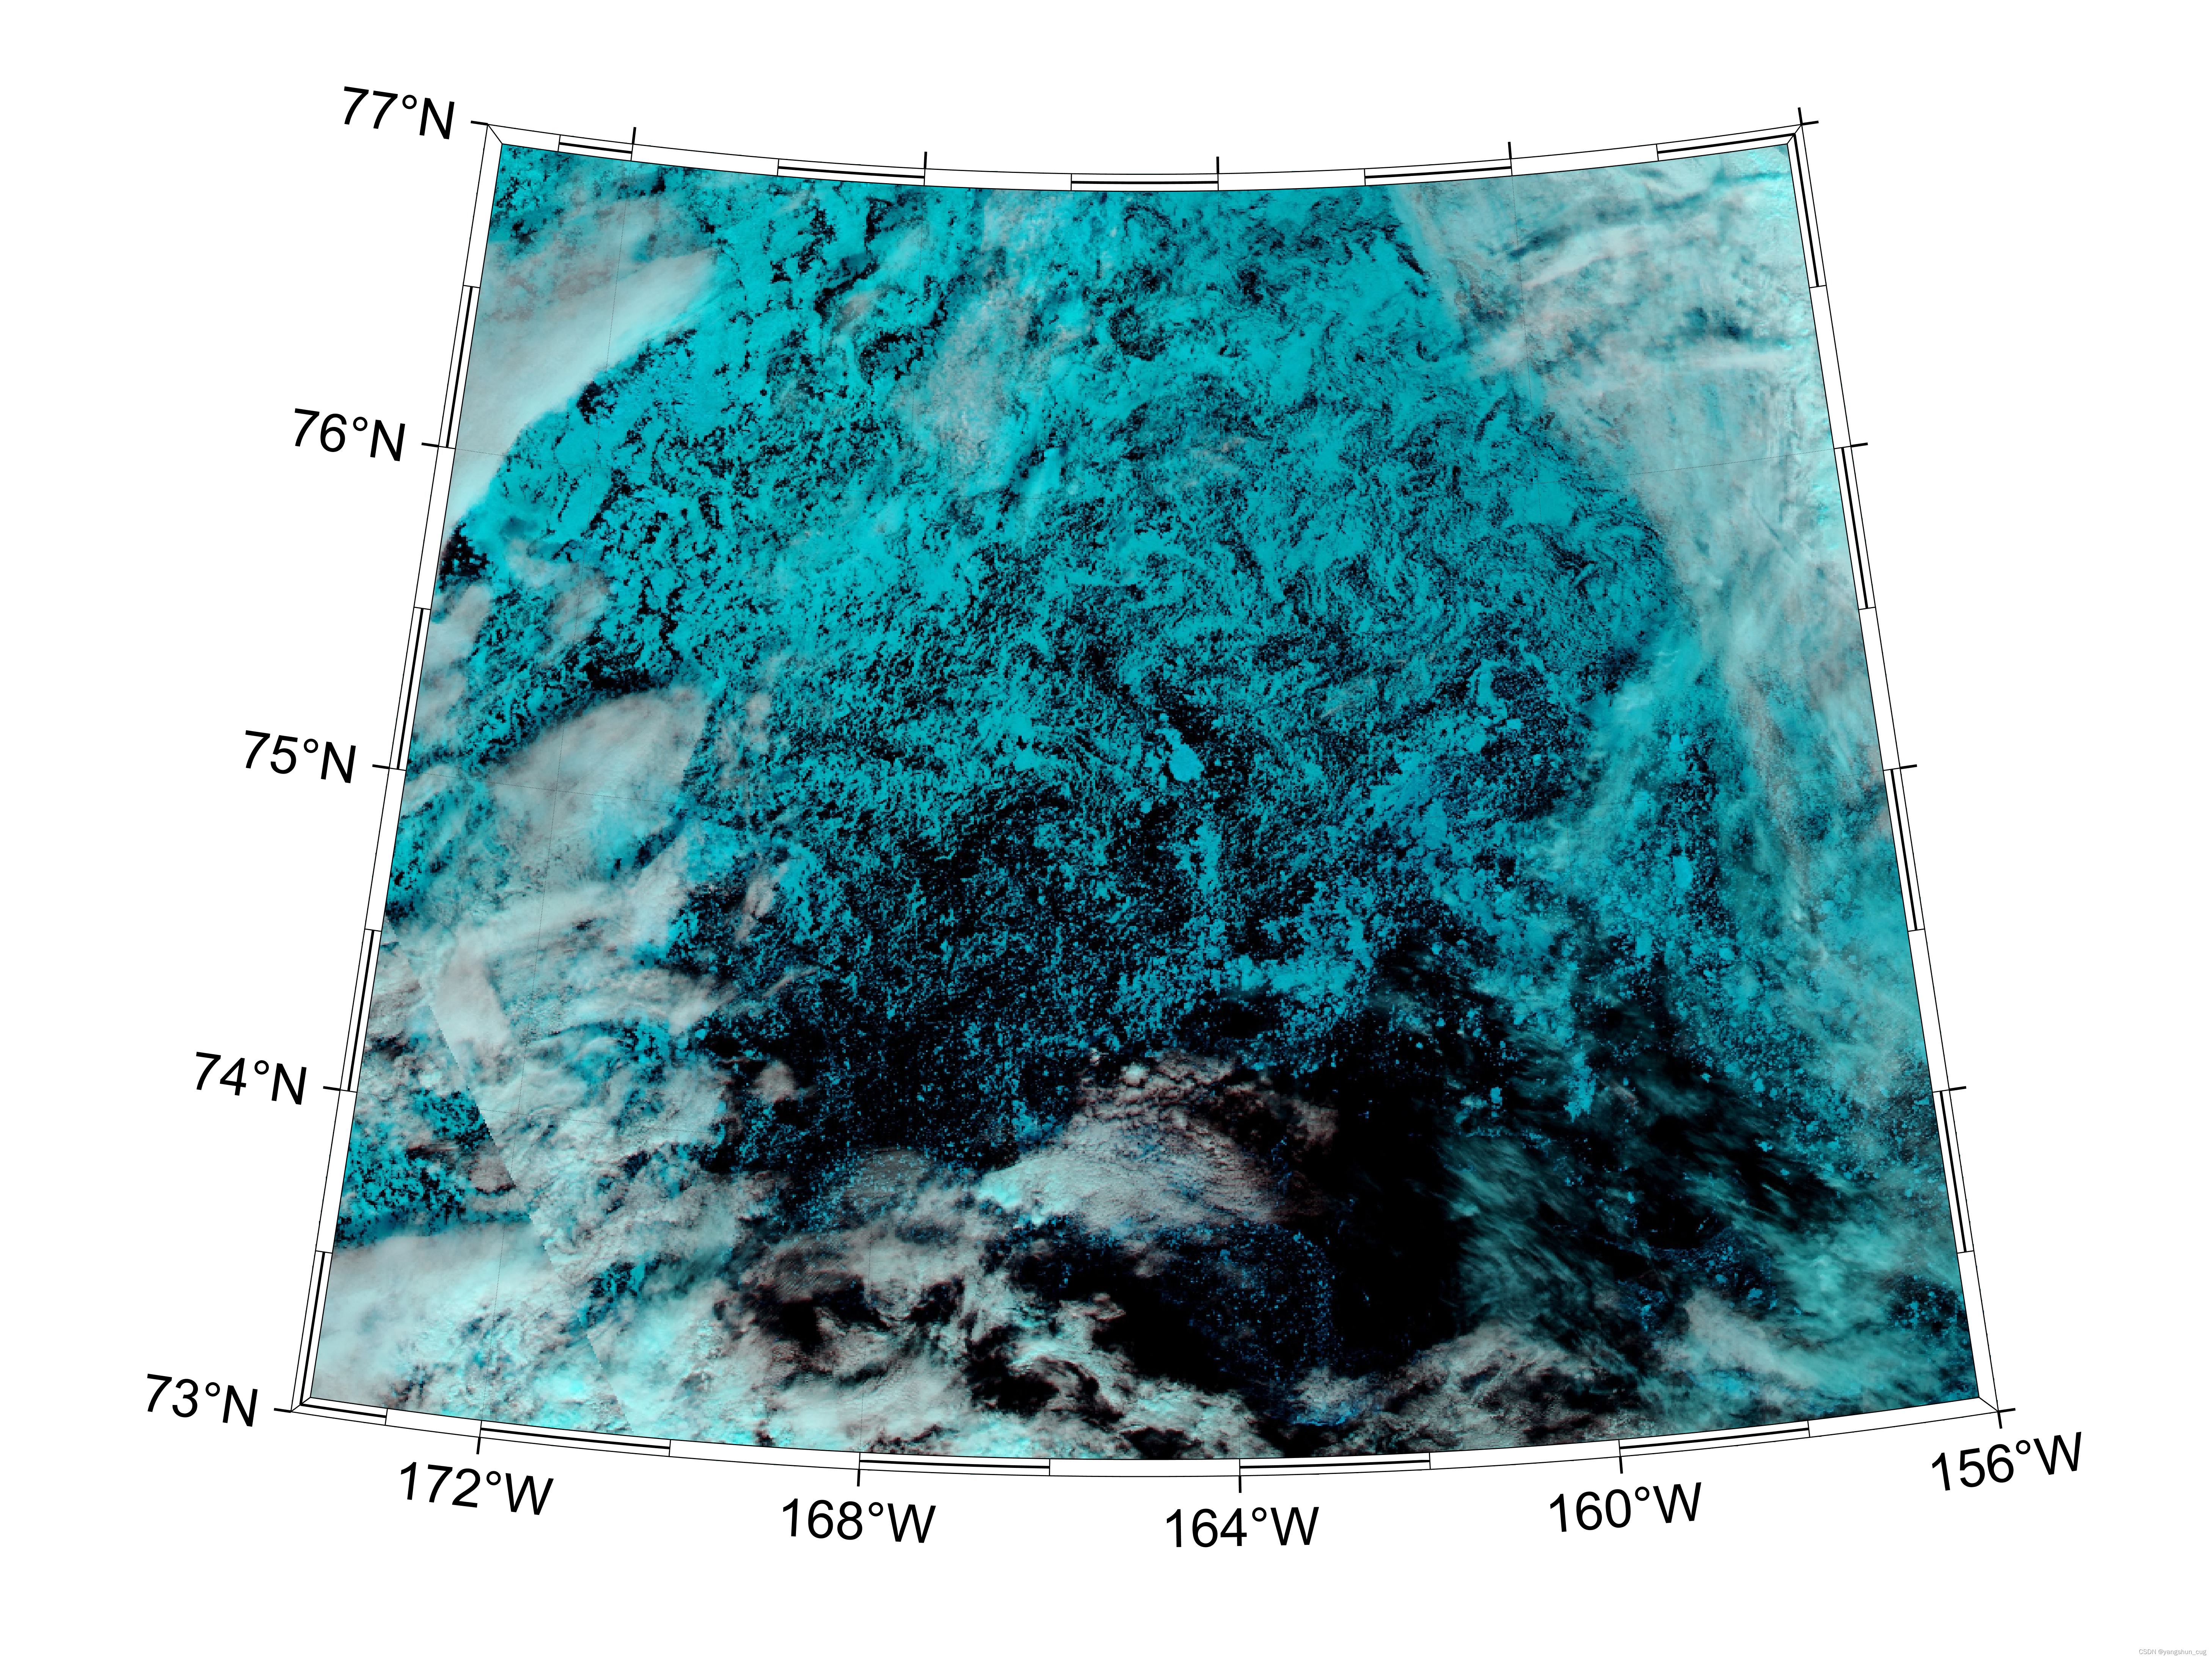
- 如果只显示遥感图像,即图窗范围=遥感图像范围:
figname='snapshot-2011-08-04-map';
figfile='snapshot-2011-08-04.png';

% 读取遥感图像数据
figdata=imread(figfile);

% 显示遥感图像
figure
imshow(figdata)

figure
% 使用lambert投影,图框经纬度范围为174-156°W,73-77°N
m_proj('lambert','long',[-174 -156],'lat',[73 77]);

hold on
% 插入遥感图,注意遥感图的纬度顺序要颠倒
m_image([-174 -156],[77 73],figdata),hold on
% 填充陆地
m_gshhs('ic','patch',[1 1 1]*0.5)

m_grid('box','fancy','tickdir','out')

print('-dpng','-r1000',[figname,'.png'])  % 导出png图片
图像如下: