echarts中清空图画
echarts中清空图画
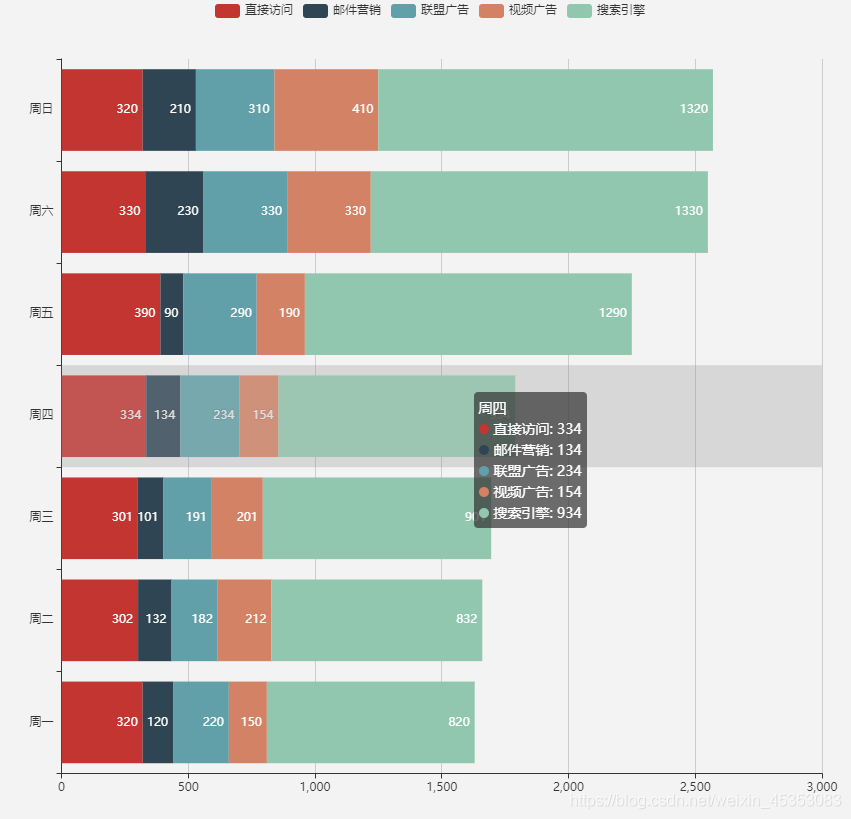
如图加上 myChart.clear(); 就可以了
<template>
  <div>
    <div id="brokenLine1" style="width: 100%; height: 600px"></div>
  </div>
</template>

<script>
import echarts from "echarts";
export default {
  components: {},
  props: {},
  data() {
    return {

    };
  },
  watch: {},
  computed: {},
  methods: {
    myEchartSbrokenLine1() {
      // 基于准备好的dom,初始化echarts实例
      var myChart = echarts.init(document.getElementById("brokenLine1"));
      // 指定图表的配置项和数据
      letoption = {
    tooltip: {
        trigger: 'axis',
        axisPointer: {            // 坐标轴指示器,坐标轴触发有效
            type: 'shadow'        // 默认为直线,可选为:'line' | 'shadow'
        }
    },
    legend: {
        data: ['直接访问', '邮件营销', '联盟广告', '视频广告', '搜索引擎']
    },
    grid: {
        left: '3%',
        right: '4%',
        bottom: '3%',
        containLabel: true
    },
    xAxis: {
        type: 'value'
    },
    yAxis: {
        type: 'category',
        data: ['周一', '周二', '周三', '周四', '周五', '周六', '周日']
    },
    series: [
        {
            name: '直接访问',
            type: 'bar',
            stack: '总量',
            label: {
                show: true,
                position: 'insideRight'
            },
            data: [320, 302, 301, 334, 390, 330, 320]
        },
        {
            name: '邮件营销',
            type: 'bar',
            stack: '总量',
            label: {
                show: true,
                position: 'insideRight'
            },
            data: [120, 132, 101, 134, 90, 230, 210]
        },
        {
            name: '联盟广告',
            type: 'bar',
            stack: '总量',
            label: {
                show: true,
                position: 'insideRight'
            },
            data: [220, 182, 191, 234, 290, 330, 310]
        },
        {
            name: '视频广告',
            type: 'bar',
            stack: '总量',
            label: {
                show: true,
                position: 'insideRight'
            },
            data: [150, 212, 201, 154, 190, 330, 410]
        },
        {
            name: '搜索引擎',
            type: 'bar',
            stack: '总量',
            label: {
                show: true,
                position: 'insideRight'
            },
            data: [820, 832, 901, 934, 1290, 1330, 1320]
        }
    ]
};
      // 使用刚指定的配置项和数据显示图表。
      myChart.clear();//清空
      myChart.setOption(option);
    },
  },
  created() {

  },
  mounted() {
    this.myEchartSbrokenLine1();
  },
};
</script>
<style lang="scss" scoped>

</style>