eharts 实现展示时间区间图
eharts 实现展示时间区间图
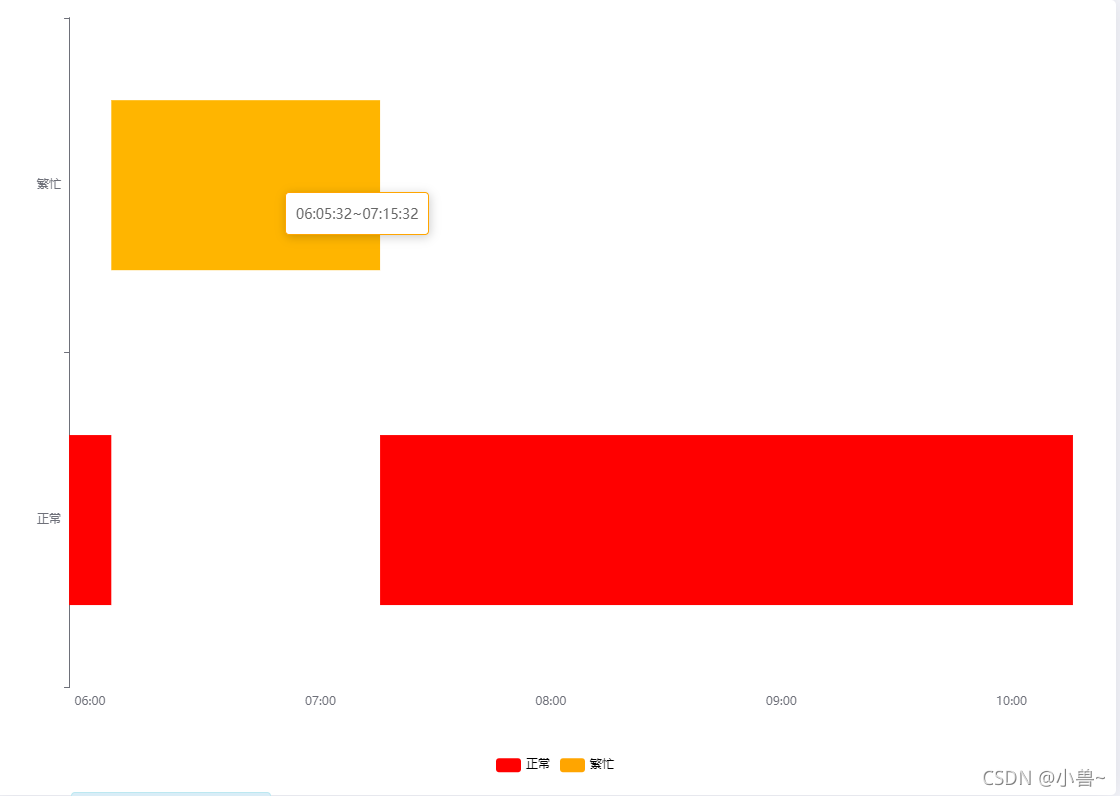
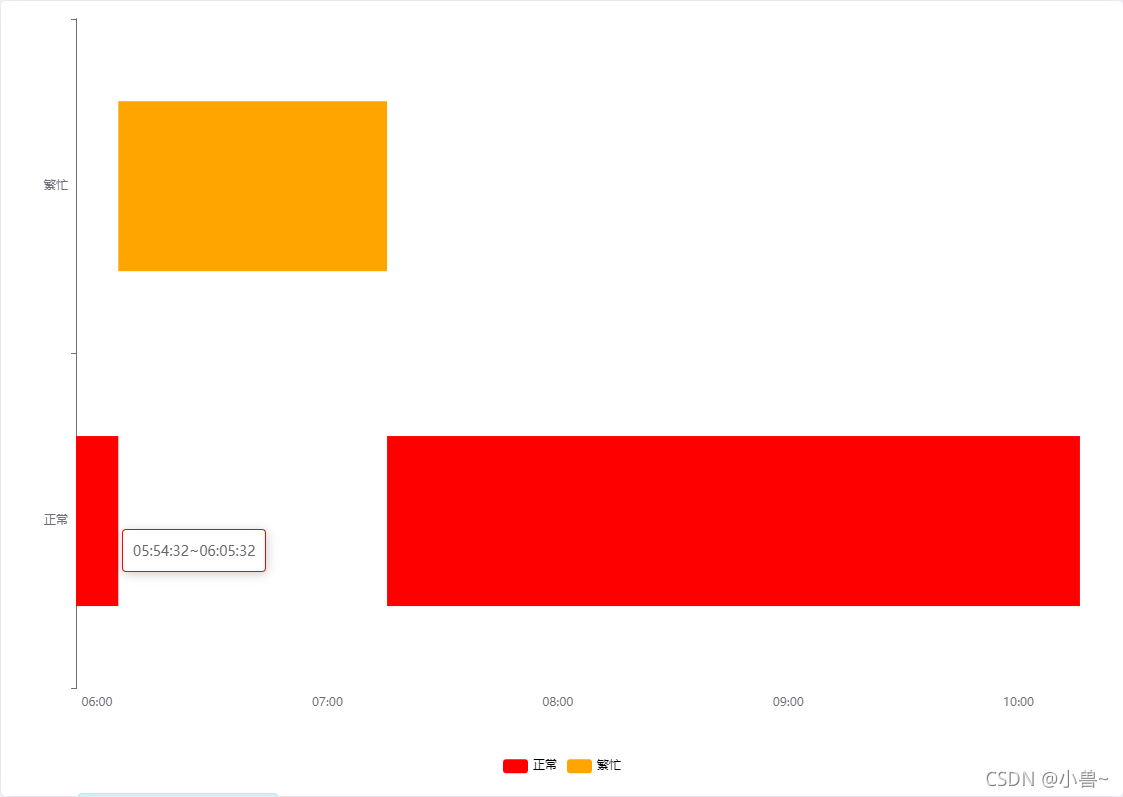
效果图如下:其中每一条都是时间区间
话不多说,代码如下所示:
import * as echarts from 'echarts';

var chartDom = document.getElementById('main');
var myChart = echarts.init(chartDom);
var option;

// 初始化echart
//var chart = echarts.init(document.getElementById('chart-box'));
// 各状态的颜色
var colors = ['red', 'orange'];
// 状态
var state = ['正常', '繁忙'];
// echart配置
var option = {
  color: colors,
  tooltip: {
    formatter: function (params) {
      return params.value[1].substr(11) + '~' + params.value[2].substr(11);
    }
  },
  legend: {
    data: state,
    bottom: '1%',
    selectedMode: false, // 图例设为不可点击
    textStyle: {
      color: '#000'
    }
  },
  grid: {
    left: '3%',
    right: '3%',
    top: '1%',
    bottom: '10%',
    containLabel: true
  },
  xAxis: {
    type: 'time',
    //设置横坐标标签格式
    axisLabel: {
      formatter: function (value) {
        var date = new Date(value);
        return getzf(date.getHours()) + ':' + getzf(date.getMinutes());
        function getzf(num) {
          if (parseInt(num) < 10) {
            num = '0' + num;
          }
          return num;
        }
      }
    }
  },
  yAxis: {
    data: state
  },
  series: [
    // 用空bar来显示图例
    { name: state[0], type: 'bar', data: [] },
    { name: state[1], type: 'bar', data: [] },
    {
      type: 'custom',
      renderItem: function (params, api) {
        //开发者自定义的图形元素渲染逻辑,是通过书写 renderItem 函数实现的
        var categoryIndex = api.value(0); //这里使用 api.value(0) 取出当前 dataItem 中第一个维度的数值。
        var start = api.coord([api.value(1), categoryIndex]); // 这里使用 api.coord(...) 将数值在当前坐标系中转换成为屏幕上的点的像素值。
        var end = api.coord([api.value(2), categoryIndex]);
        var height = 170;

        return {
          type: 'rect', // 表示这个图形元素是矩形。还可以是 'circle', 'sector', 'polygon' 等等。
          shape: echarts.graphic.clipRectByRect(
            {
              // 矩形的位置和大小。
              x: start[0],
              y: start[1] - height / 2,
              width: end[0] - start[0],
              height: height
            },
            {
              // 当前坐标系的包围盒。
              x: params.coordSys.x,
              y: params.coordSys.y,
              width: params.coordSys.width,
              height: params.coordSys.height
            }
          ),
          style: api.style()
        };
      },
      encode: {
        x: [1, 2],
        y: 0
      },
      data: [
        {
          //0表示正常;1表示繁忙
          value: [0, '2021-11-18 05:54:32', '2021-11-18 06:05:32'],
          itemStyle: {
            color: colors[0]
          }
        },
        {
          value: [1, '2021-11-18 06:05:32', '2021-11-18 07:15:32'],
          itemStyle: {
            color: colors[1]
          }
        },
        {
          value: [0, '2021-11-18 07:15:32', '2021-11-18 10:15:59'],
          itemStyle: {
            color: colors[0]
          }
        }
      ]
    }
  ]
};

option && myChart.setOption(option);