使用 YOLOv5 进行图像分割的实操案例
如何训练 YOLOv5 进行分割?简单来讲,包括几个步骤:
为图像分割准备数据集
在自定义数据集上训练 YOLOv5
使用 YOLOv5 进行推理
准备数据集
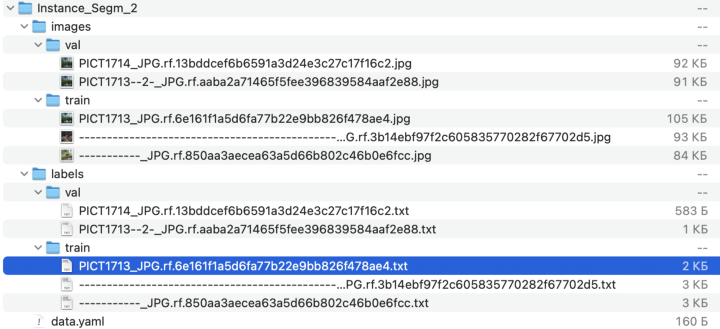
第一步,您需要以适当的格式准备数据集。这种格式与用于检测的 YOLOv5 格式非常相似。您需要创建类似如下所示的目录:

让我们看一下 data.yaml 文件的内部。该文件具有与检测任务相同的结构。其结构如下图所示:

data.yaml 文件的结构
train - path to your train images
val - path to your validation images
nc - number of classes
names - сlass names
让我们看一下 .txt 文件的内部。

第一个元素是“0”,表示类别数。下一个值是多边形的 x 和 y 坐标。这些坐标被归一化为原始图像的大小。如果你想查看带有这个多边形的图像,可以使用下面的函数。第一个打开图像和标记文件,第二个显示图像和标记。
def read_image_label(path_to_img: str, path_to_txt: str, normilize: bool = False) -> Tuple[np.array, np.array]:

    # read image
    image = cv2.imread(path_to_img)
    image = cv2.cvtColor(image, cv2.COLOR_BGR2RGB)
    img_h, img_w = image.shape[:2]

    # read .txt file for this image
    with open(path_to_txt, "r") as f:
        txt_file = f.readlines()[0].split()
        cls_idx = txt_file[0]
        coords = txt_file[1:]
        polygon = np.array([[eval(x), eval(y)] for x, y in zip(coords[0::2], coords[1::2])]) # convert list of coordinates to numpy massive

    # Convert normilized coordinates of polygons to coordinates of image
    if normilize:
        polygon[:,0] = polygon[:,0]*img_w
        polygon[:,1] = polygon[:,1]*img_h
    return image, polygon.astype(np.int)


def show_image_mask(img: np.array, polygon: np.array, alpha: float = 0.7):

    # Create zero array for mask
    mask = np.zeros((img.shape[0], img.shape[1]), dtype=np.uint8)
    overlay = img.copy()

    # Draw polygon on the image and mask
    cv2.fillPoly(mask, pts=[polygon], color=(255, 255, 255))
    cv2.fillPoly(img, pts=[polygon], color=(255, 0, 0))
    cv2.addWeighted(overlay, alpha, image, 1 - alpha, 0, image)

    # Plot image with mask
    fig = plt.figure(figsize=(22,18))
    axes = fig.subplots(nrows=1, ncols=2)
    axes[0].imshow(img)
    axes[1].imshow(mask, cmap="Greys_r")
    axes[0].set_title("Original image with mask")
    axes[1].set_title("Mask")

    plt.show()
经过上述代码处理后的结果如下所示:

在某些情况下,您可能没有多边形数据,但有二进制掩码。因此拥有将二进制掩码转换为多边形的功能将很有用。此类功能的示例如下所示:
def mask_to_polygon(mask: np.array, report: bool = False) -> List[int]:
    contours, _ = cv2.findContours(mask, cv2.RETR_TREE, cv2.CHAIN_APPROX_SIMPLE)
    polygons = []
    for object in contours:
        coords = []


        for point in object:
            coords.append(int(point[0][0]))
            coords.append(int(point[0][1]))
        polygons.append(coords)

    if report:
        print(f"Number of points = {len(polygons[0])}")

    return np.array(polygons).ravel().tolist()

polygons = mask_to_polygon(mask, report=True)
得到结果如下:
Number of points: 1444其中 x 和 y 坐标分别为 722 个点。
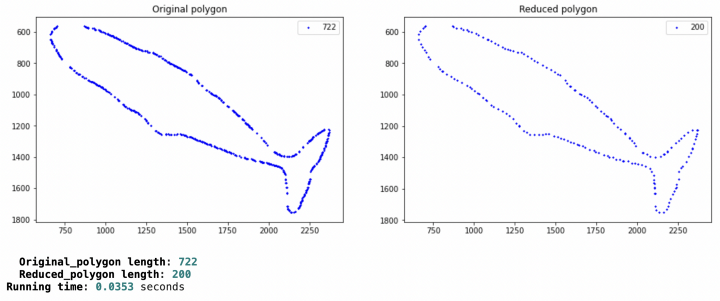
原则上,我们可以继续在此基础上训练模型,但我想举一个例子,说明另一个函数,它可以减少将掩码转换为多边形后获得的点的数目。当您不想突出显示具有太多点的对象时,这很有用。
def reduce_polygon(polygon: np.array, angle_th: int = 0, distance_th: int = 0) -> np.array(List[int]):
    angle_th_rad = np.deg2rad(angle_th)
    points_removed = [0]
    while len(points_removed):
        points_removed = list()
        for i in range(0, len(polygon)-2, 2):
            v01 = polygon[i-1] - polygon[i]
            v12 = polygon[i] - polygon[i+1]
            d01 = np.linalg.norm(v01)
            d12 = np.linalg.norm(v12)
            if d01 < distance_th and d12 < distance_th:
                points_removed.append(i)
                continue
                angle = np.arccos(np.sum(v01*v12) / (d01 * d12))
                if angle < angle_th_rad:
                    points_removed.append(i)
        polygon = np.delete(polygon, points_removed, axis=0)
    return polygon


def show_result_reducing(polygon: List[List[int]]) -> List[Tuple[int, int]]:
    original_polygon = np.array([[x, y] for x, y in zip(polygon[0::2], polygon[1::2])])


    tic = time()
    reduced_polygon = reduce_polygon(original_polygon, angle_th=1, distance_th=20)
    toc = time()


    fig = plt.figure(figsize=(16,5))
    axes = fig.subplots(nrows=1, ncols=2)
    axes[0].scatter(original_polygon[:, 0], original_polygon[:, 1], label=f"{len(original_polygon)}", c='b', marker='x', s=2)
    axes[1].scatter(reduced_polygon[:, 0], reduced_polygon[:, 1], label=f"{len(reduced_polygon)}", c='b', marker='x', s=2)
    axes[0].invert_yaxis()
    axes[1].invert_yaxis()

    axes[0].set_title("Original polygon")
    axes[1].set_title("Reduced polygon")
    axes[0].legend()
    axes[1].legend()

    plt.show()


    print("\n\n", f'[bold black] Original_polygon length[/bold black]: {len(original_polygon)}\n',
          f'[bold black] Reduced_polygon length[/bold black]: {len(reduced_polygon)}\n'
          f'[bold black]Running time[/bold black]: {round(toc - tic, 4)} seconds')

    return reduced_polygon
函数的输出如下所示:

x 和 y 分别有 722 个点。经过处理之后,x 和 y 分别变成了 200 点。
至此,我们继续训练模型。
在自定义数据集上训练 YOLOv5
在这里,您需要执行以下步骤:
git clone https://github.com/ultralytics/yolov5.git
pip install -r requirements.txt
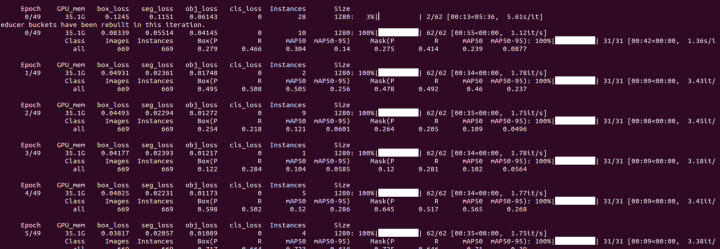
当您将 YOLOv5 完整项目代码 git clone 到您本地并安装库后,您就可以开始学习过程了。此处有使用预训练模型。
python3 segment/train.py
--data "/Users/vladislavefremov/Downloads/Instance_Segm_2/data.yaml"
--weights yolov5s-seg.pt
--img 640
--batch-size 2
--epochs 50
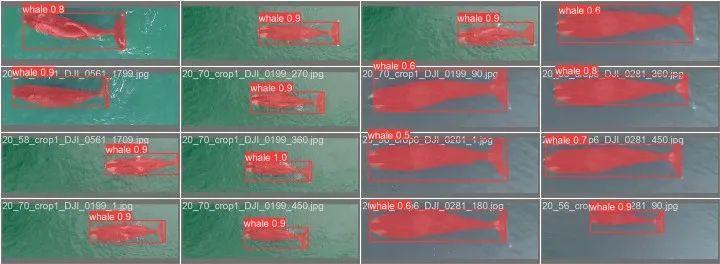
训练结束后,可以看看验证集上的结果:

模型在验证集上的预测
如果你想了解更多关于 YOLOv5 参数的信息,可以查看官方代码(https://github.com/ultralytics/yolov5)
使用 YOLOv5 推理
我们已经训练了模型,现在我们可以从照片、包含照片的目录、视频、包含视频的目录等进行推理。
让我们对一个视频进行推理,看看最后的结果。
python3 segment/predict.py
--weights "/home/user/Disk/Whales/weights/whale_3360/weights/best.pt"
--source "/home/user/Disk/Whales/Video"
--imgsz 1280
--name video_whale
得到视频地址:https://youtu.be/_j8sA6VUil4
推理后得到的结果是什么形式?多边形且含有类索引 x 和 y 坐标的绝对值。

结论
在本文中,我们研究了如何为 YOLOv5 算法的分割准备数据;快速将 mask 矩阵转换为多边形的函数。我们了解了如何训练 YOLOv5 算法并在训练后进行推理。
· END ·
HAPPY LIFE
