Matlab下地形图绘图包m_map绘图包绘制高分辨率海岸线、国界线与河流
1. 前言
之前说了m_map的下载、安装与基本使用(Matlab下地形图绘图包m_map安装与使用),以及晕渲地形图的绘制(m_map绘制晕渲(shaded relief)地形图),现在再说一下高分辨率海岸线、国界线与河流的绘制。
2. 安装
高分辨率地形和海岸线数据的安装已经在Matlab下地形图绘图包m_map安装与使用中说的比较详细了,这里不再赘述。
3. 参数设置
可以打开m_gshhs函数查看具体设置。
>> help m_gshhs
  m_gshhs Add a coastline to a given map using
            the Global Self-consistant Hierarchical High-resolution
            Shorelines, Rivers, and Borders

          m_gshhs(RES, (standard line option,...,...) ) draws the coastline
          river network, or borders as  simple lines.

          m_gshhs(RES,'patch' ( ,standard patch options,...,...) ) draws the
          coastline as a number of patches (rivers and borders are not
          arranged so patches can be drawn).

          m_gshhs(RES,'save',FILENAME) saves the extracted coastline data
          for the current projection in a file FILENAME. This allows
          speedier replotting using M_USERCOAST(FILENAME).

          RES: A one-char string (optionally 2 or 3)

          First char: resolution - one of
                       'c'  crude
                       'l'  low
                       'i'  intermediate
                       'h'  high
                       'f'  full

          Second char: type - one of
                       'c' GSHHS coastline (default)
                       'b' WDB Border
                       'r' WDB River

          Third char - if 2nd char is 'b':
                       '1' Country borders
                       '2' State/Province and Country borders
                     - if 2nd char is 'r': '1','2','3','4'
                       add successively more tributaries

          (also maintained is this optional format:

          RES - selections resolution
                   1  or 'crude'
                   2  or 'low'
                   3  or 'intermediate'
                   4  or 'high'
                   5  or 'full

          but please don't use this).

          See also m_proj, m_grid, m_coast, m_gshhs_l, m_gshhs_h, m_gshhs_c
          m_usercoast
这里简要说一下用法。
c、b、r分别表示海岸线,国界线与河流
c、l、i、h、f 分别表示粗糙/低/中/高/满分辨率
具体使用时,c/b/r与 c/l/i/h/f 二者组合使用。
m_gshhs('lc','patch','k'); % 低分辨率海岸线,陆地填充:黑色
m_gshhs('ib’,’color','k'); % 中分辨率国界线,黑色
m_gshhs('fr','color','b'); % 满分辨率河流,蓝色
4. 实例说明
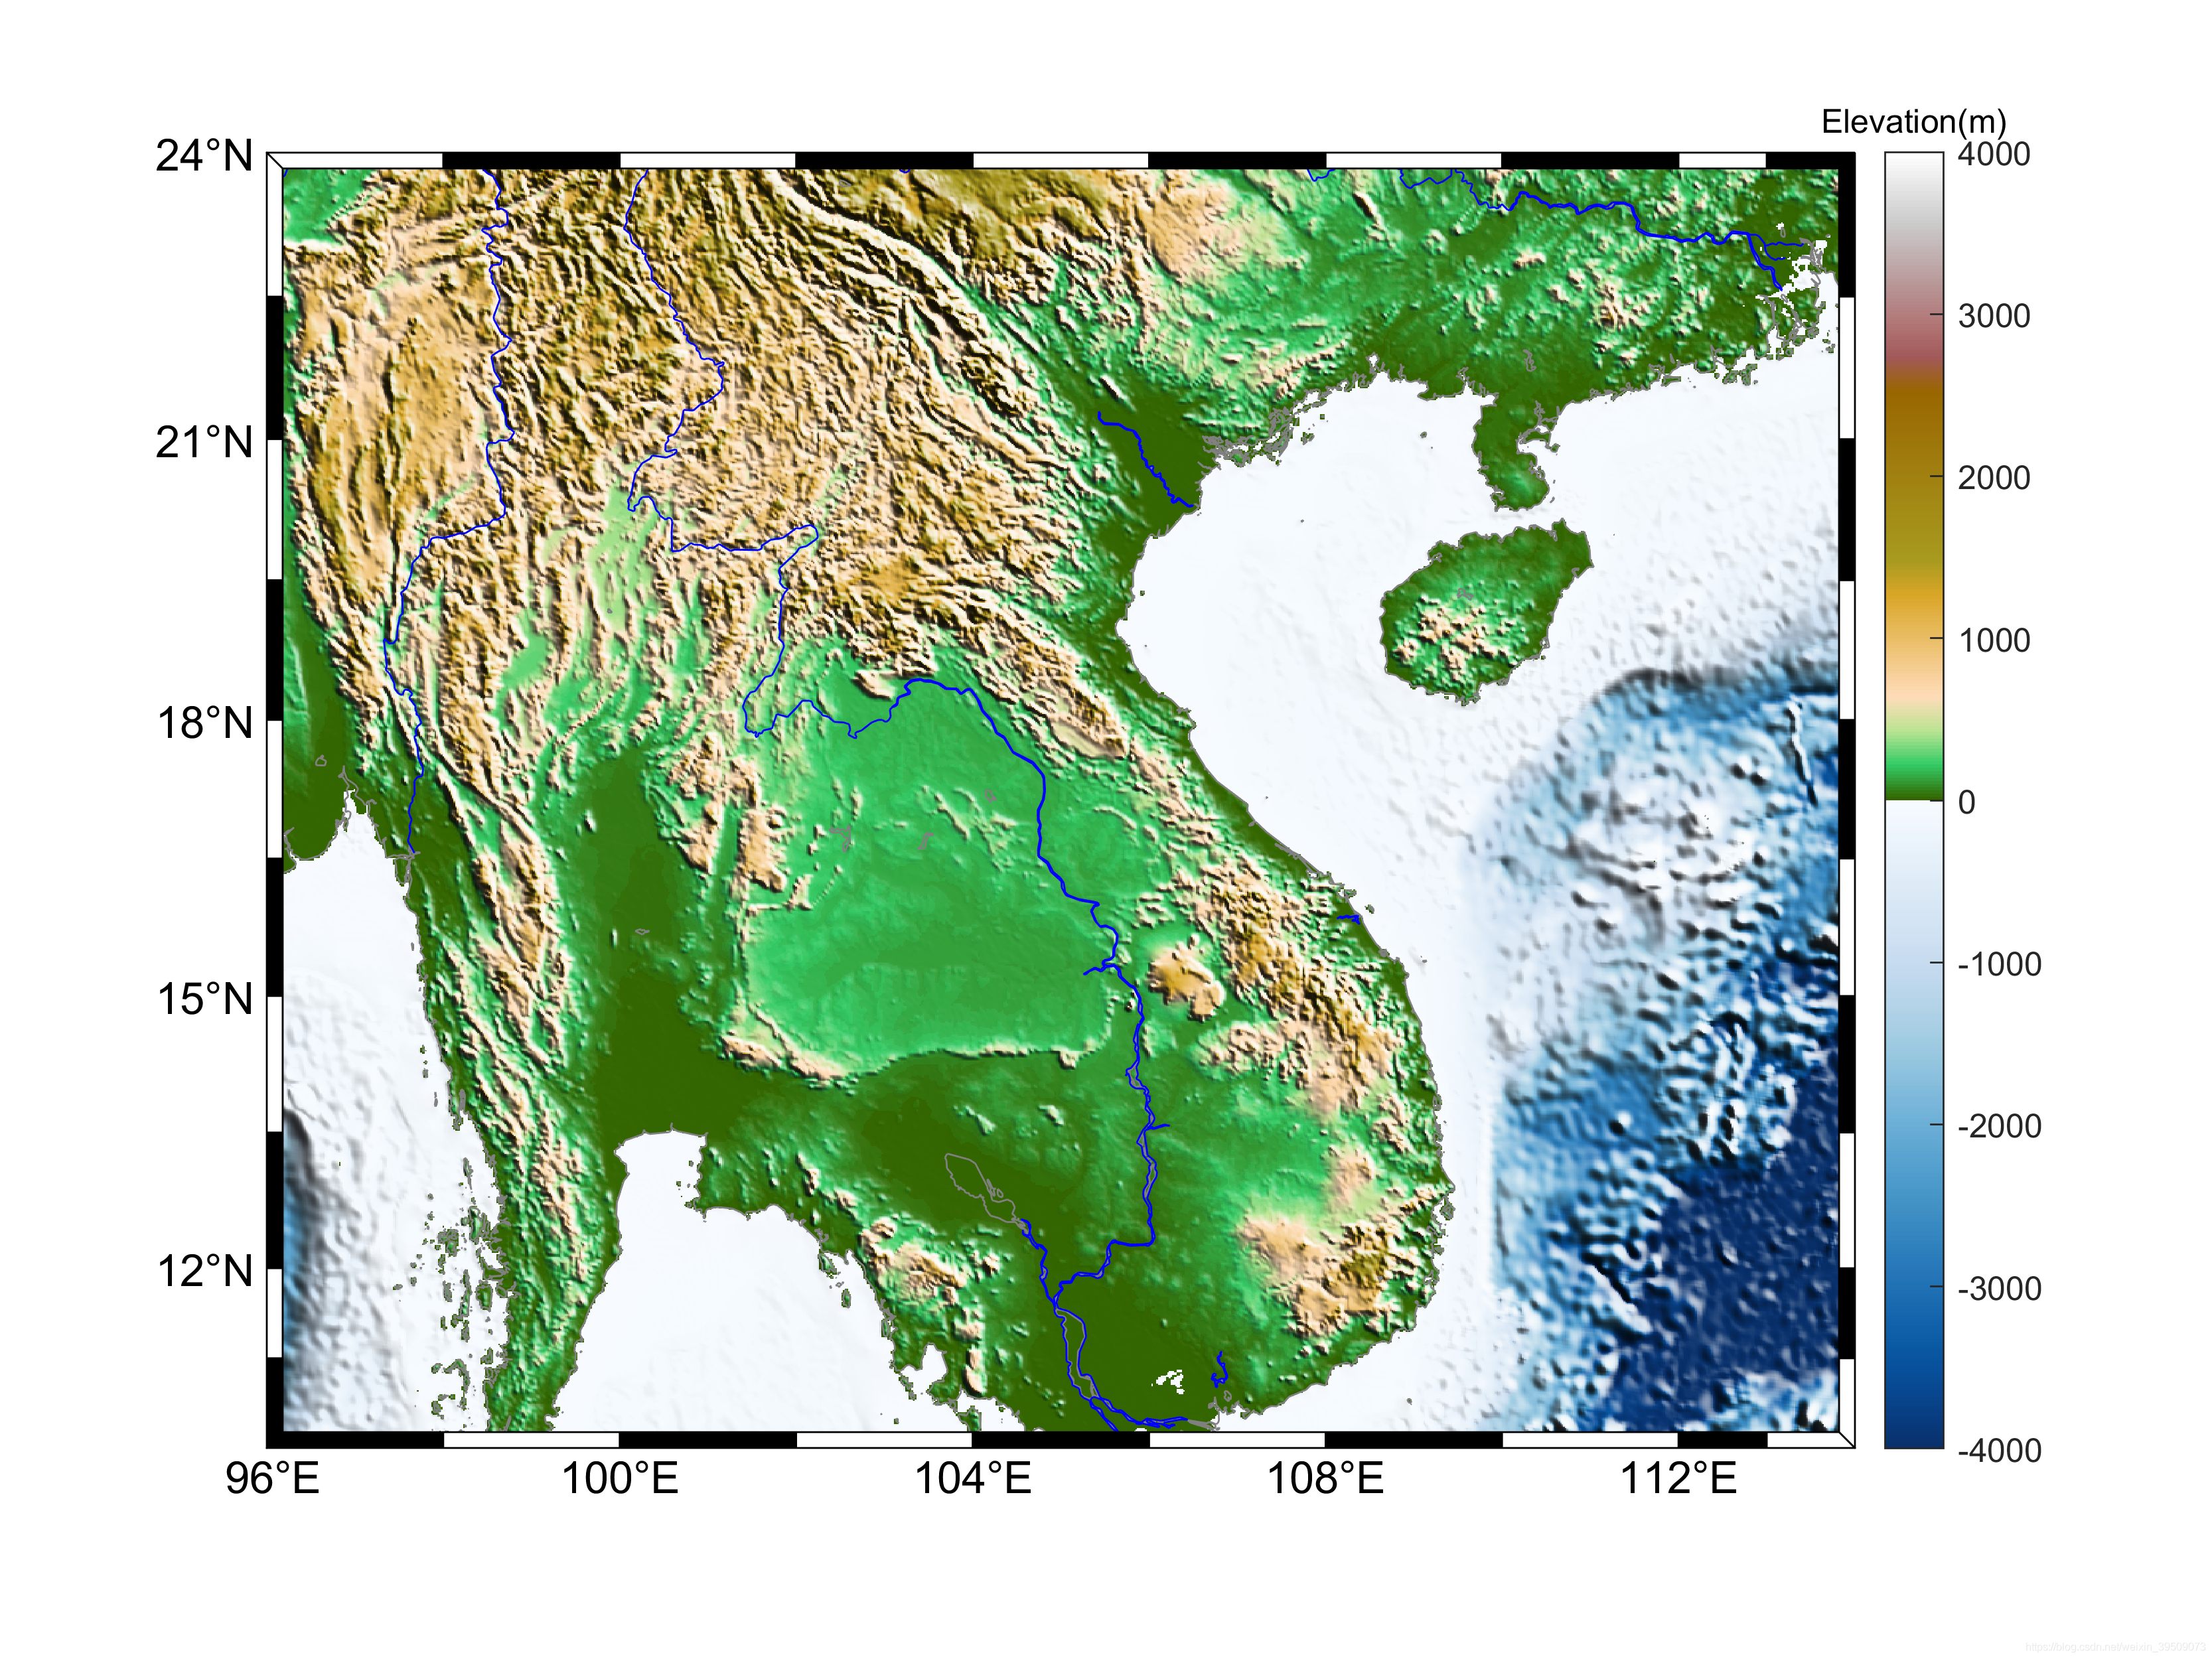
下面在m_map绘制晕渲(shaded relief)地形图的基础上说一下河流与国界线的添加。
4.1 例1
在晕渲图上只添加灰色的中等分辨率的海岸线。
figname='gshhs1';
figure
m_proj('mercator','long',[96 114],'lat',[10 24]);

caxis([-4000 4000])
% %caxis要放在colormap之前,colormap要放在m_shadedrelief之前
colormap([m_colmap('blue',200);m_colmap('gland',200)])
hc=colorbar;
set(get(hc,'title'),'string','Elevation(m)')

m_etopo2('shadedrelief','lightangle',45);

m_gshhs('ic','color',[.5 .5 .5])

m_grid('box','fancy','tickdir','in','gridlines','no','fontsize',12)

set(gcf,'position',[100 100 800 600])
print('-dpng','-r400',[figname,'.png'])

4.2 例2
再添加中等分辨率的河流,分支参数设置为1
figname='gshhs2';
figure
m_proj('mercator','long',[96 114],'lat',[10 24]);

caxis([-4000 4000])
% %caxis要放在colormap之前,colormap要放在m_shadedrelief之前
colormap([m_colmap('blue',200);m_colmap('gland',200)])
hc=colorbar;
set(get(hc,'title'),'string','Elevation(m)')

m_etopo2('shadedrelief','lightangle',45);

m_gshhs('ic','color',[.5 .5 .5])
m_gshhs('ir1','color','b')

m_grid('box','fancy','tickdir','in','gridlines','no','fontsize',12)

set(gcf,'position',[100 100 800 600])
print('-dpng','-r400',[figname,'.png'])

4.3 例3
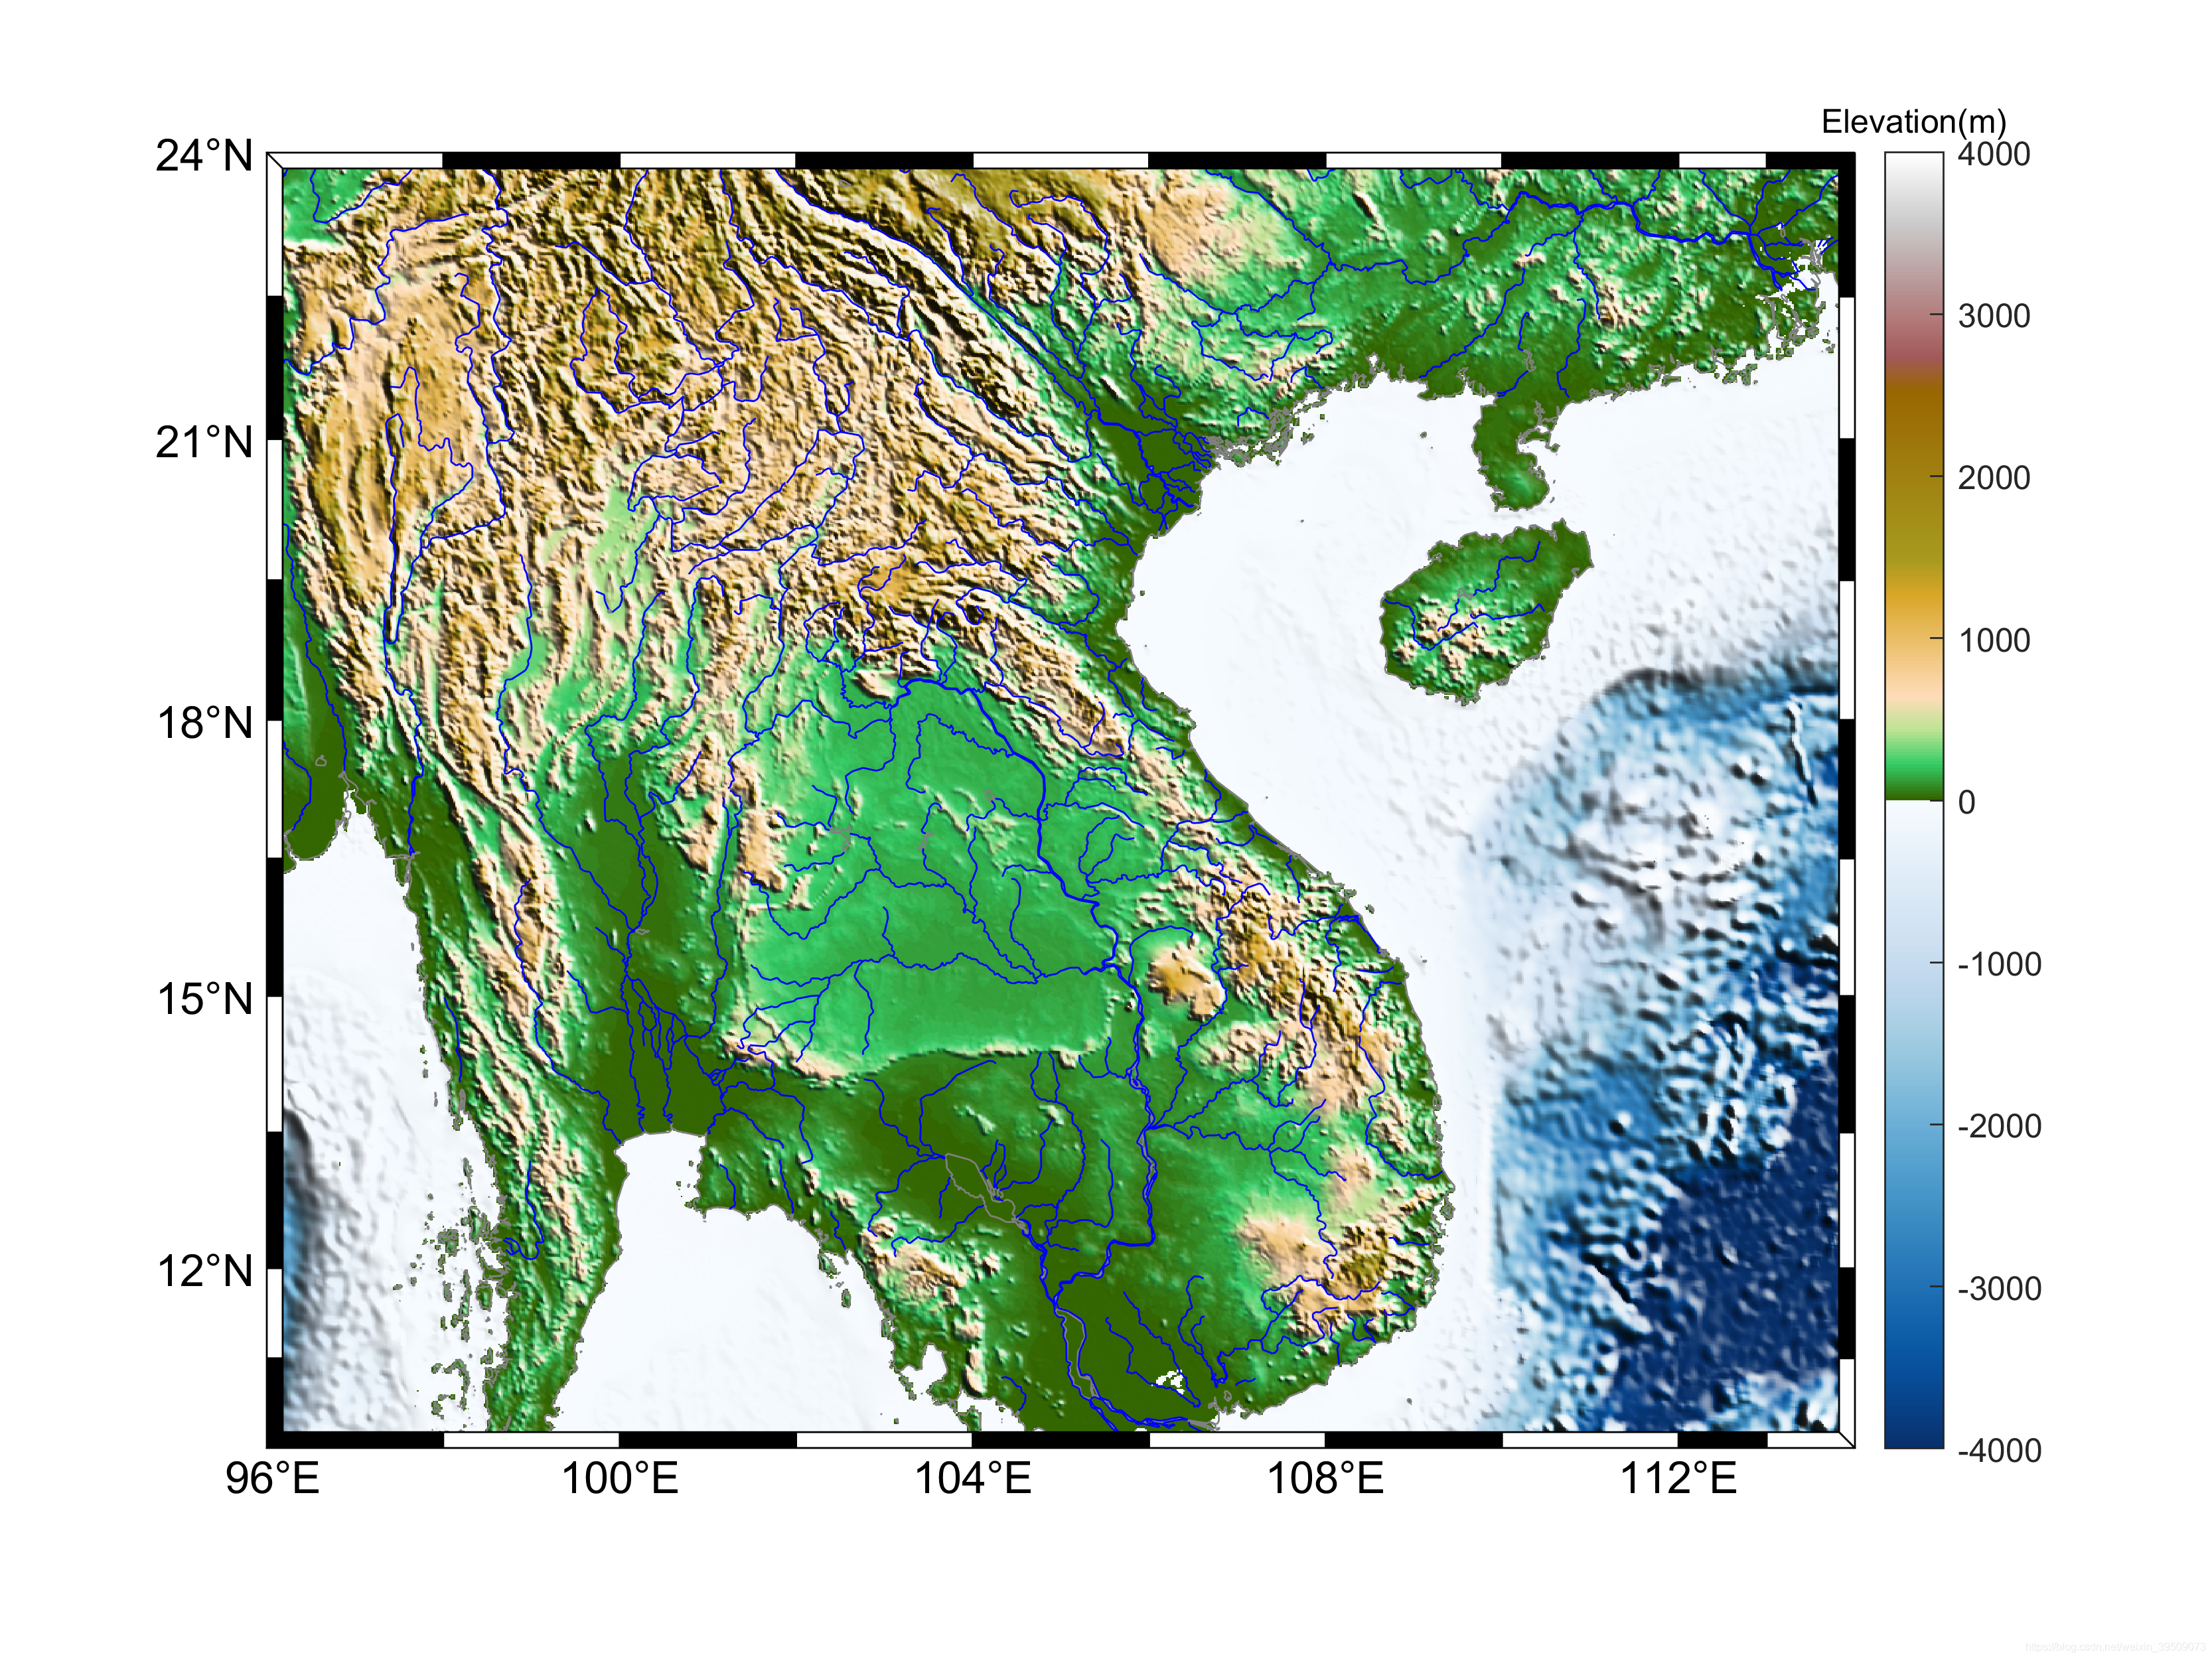
添加中等分辨率的河流,分支参数设置为2
%%
figname='gshhs3';
figure
m_proj('mercator','long',[96 114],'lat',[10 24]);

caxis([-4000 4000])
% %caxis要放在colormap之前,colormap要放在m_shadedrelief之前
colormap([m_colmap('blue',200);m_colmap('gland',200)])
hc=colorbar;
set(get(hc,'title'),'string','Elevation(m)')

m_etopo2('shadedrelief','lightangle',45);

m_gshhs('ic','color',[.5 .5 .5])
m_gshhs('ir2','color','b')

m_grid('box','fancy','tickdir','in','gridlines','no','fontsize',12)

set(gcf,'position',[100 100 800 600])
print('-dpng','-r400',[figname,'.png'])

4.4 例4
添加中等分辨率的河流,分支参数设置为3
figname='gshhs4';
figure
m_proj('mercator','long',[96 114],'lat',[10 24]);

caxis([-4000 4000])
% %caxis要放在colormap之前,colormap要放在m_shadedrelief之前
colormap([m_colmap('blue',200);m_colmap('gland',200)])
hc=colorbar;
set(get(hc,'title'),'string','Elevation(m)')

m_etopo2('shadedrelief','lightangle',45);

m_gshhs('ic','color',[.5 .5 .5])
m_gshhs('ir3','color','b')

m_grid('box','fancy','tickdir','in','gridlines','no','fontsize',12)

set(gcf,'position',[100 100 800 600])

4.5 例5
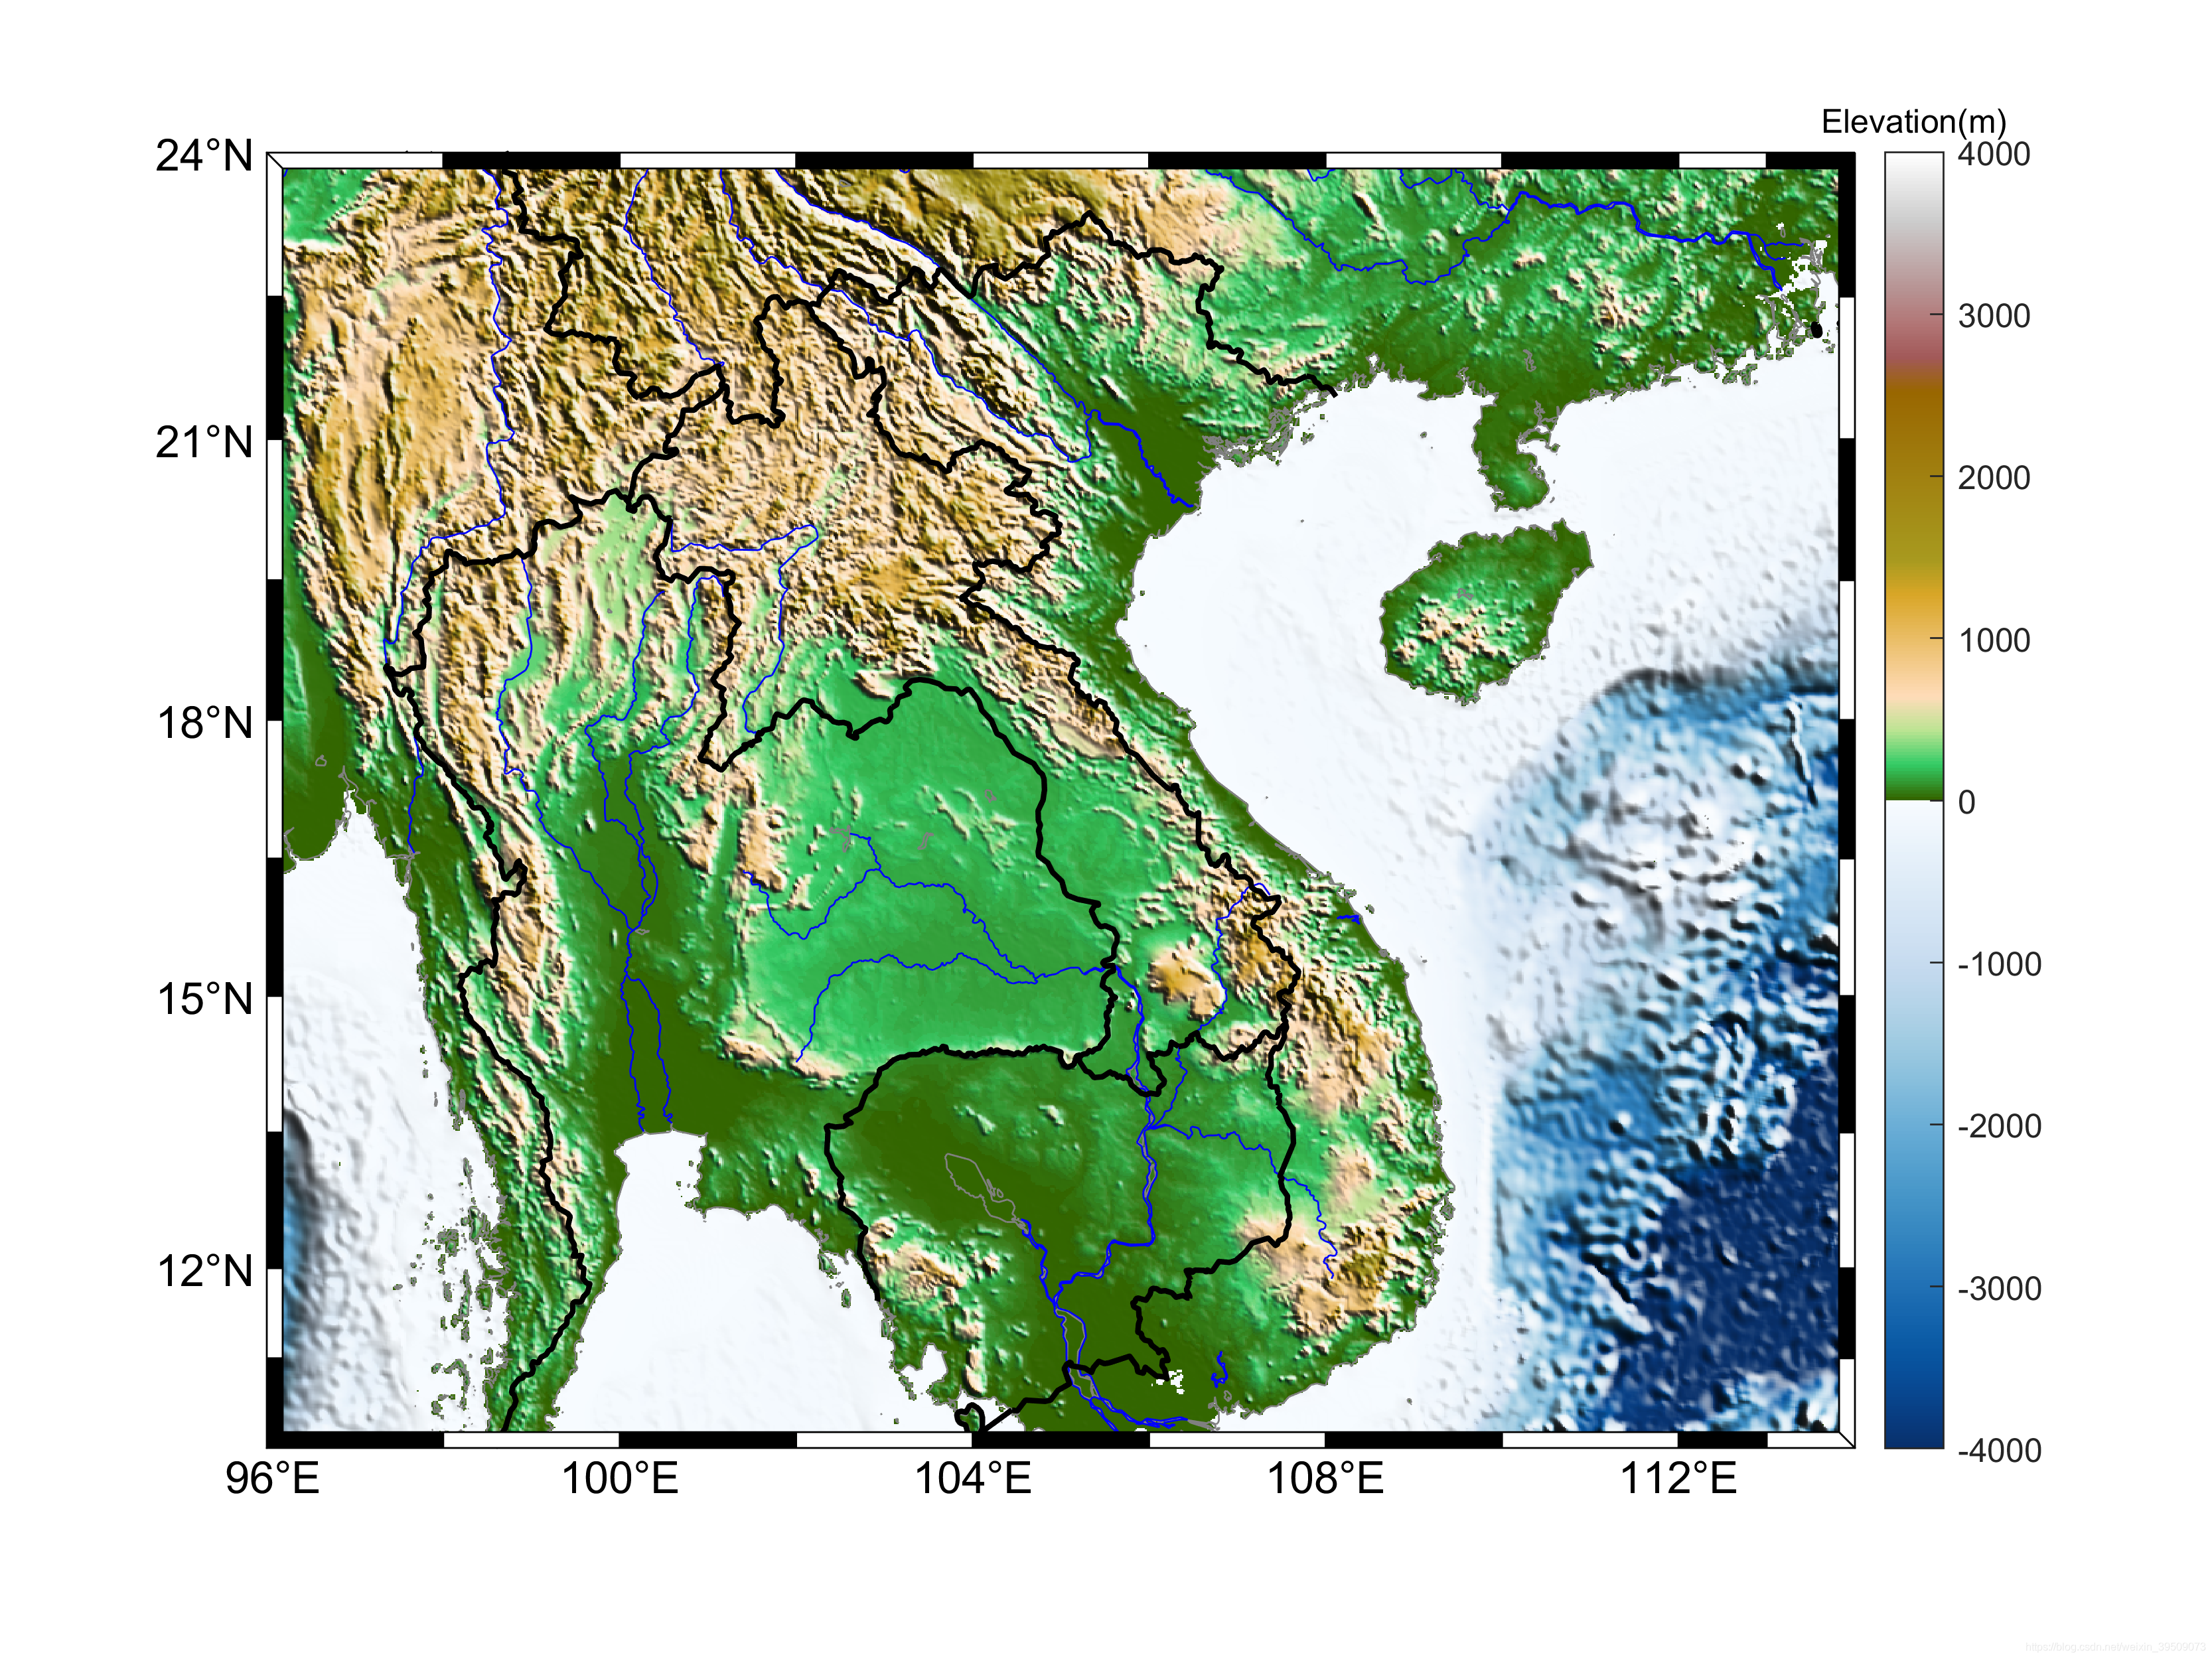
添加中等分辨率的河流,分支参数设置为3,添加中等分辨率国界线
figname='gshhs5';
figure
m_proj('mercator','long',[96 114],'lat',[10 24]);

caxis([-4000 4000])
% %caxis要放在colormap之前,colormap要放在m_shadedrelief之前
colormap([m_colmap('blue',200);m_colmap('gland',200)])
hc=colorbar;
set(get(hc,'title'),'string','Elevation(m)')

m_etopo2('shadedrelief','lightangle',45);

m_gshhs('ic','color',[.5 .5 .5])
m_gshhs('ir3','color','b')
m_gshhs('ib','color','k','linewid',1.5)

m_grid('box','fancy','tickdir','in','gridlines','no','fontsize',12)

set(gcf,'position',[100 100 800 600])
print('-dpng','-r400',[figname,'.png'])

4.6 例6
添加中等分辨率的河流,分支参数设置为2,添加中等分辨率国界线
figname='gshhs6';
figure
m_proj('mercator','long',[96 114],'lat',[10 24]);

caxis([-4000 4000])
% %caxis要放在colormap之前,colormap要放在m_shadedrelief之前
colormap([m_colmap('blue',200);m_colmap('gland',200)])
hc=colorbar;
set(get(hc,'title'),'string','Elevation(m)')

m_etopo2('shadedrelief','lightangle',45);

m_gshhs('ic','color',[.5 .5 .5])
m_gshhs('ir2','color','b')
m_gshhs('ib','color','k','linewid',1.5)

m_grid('box','fancy','tickdir','in','gridlines','no','fontsize',12)

set(gcf,'position',[100 100 800 600])
print('-dpng','-r400',[figname,'.png'])

END