Matlab绘制带误差线的柱状图
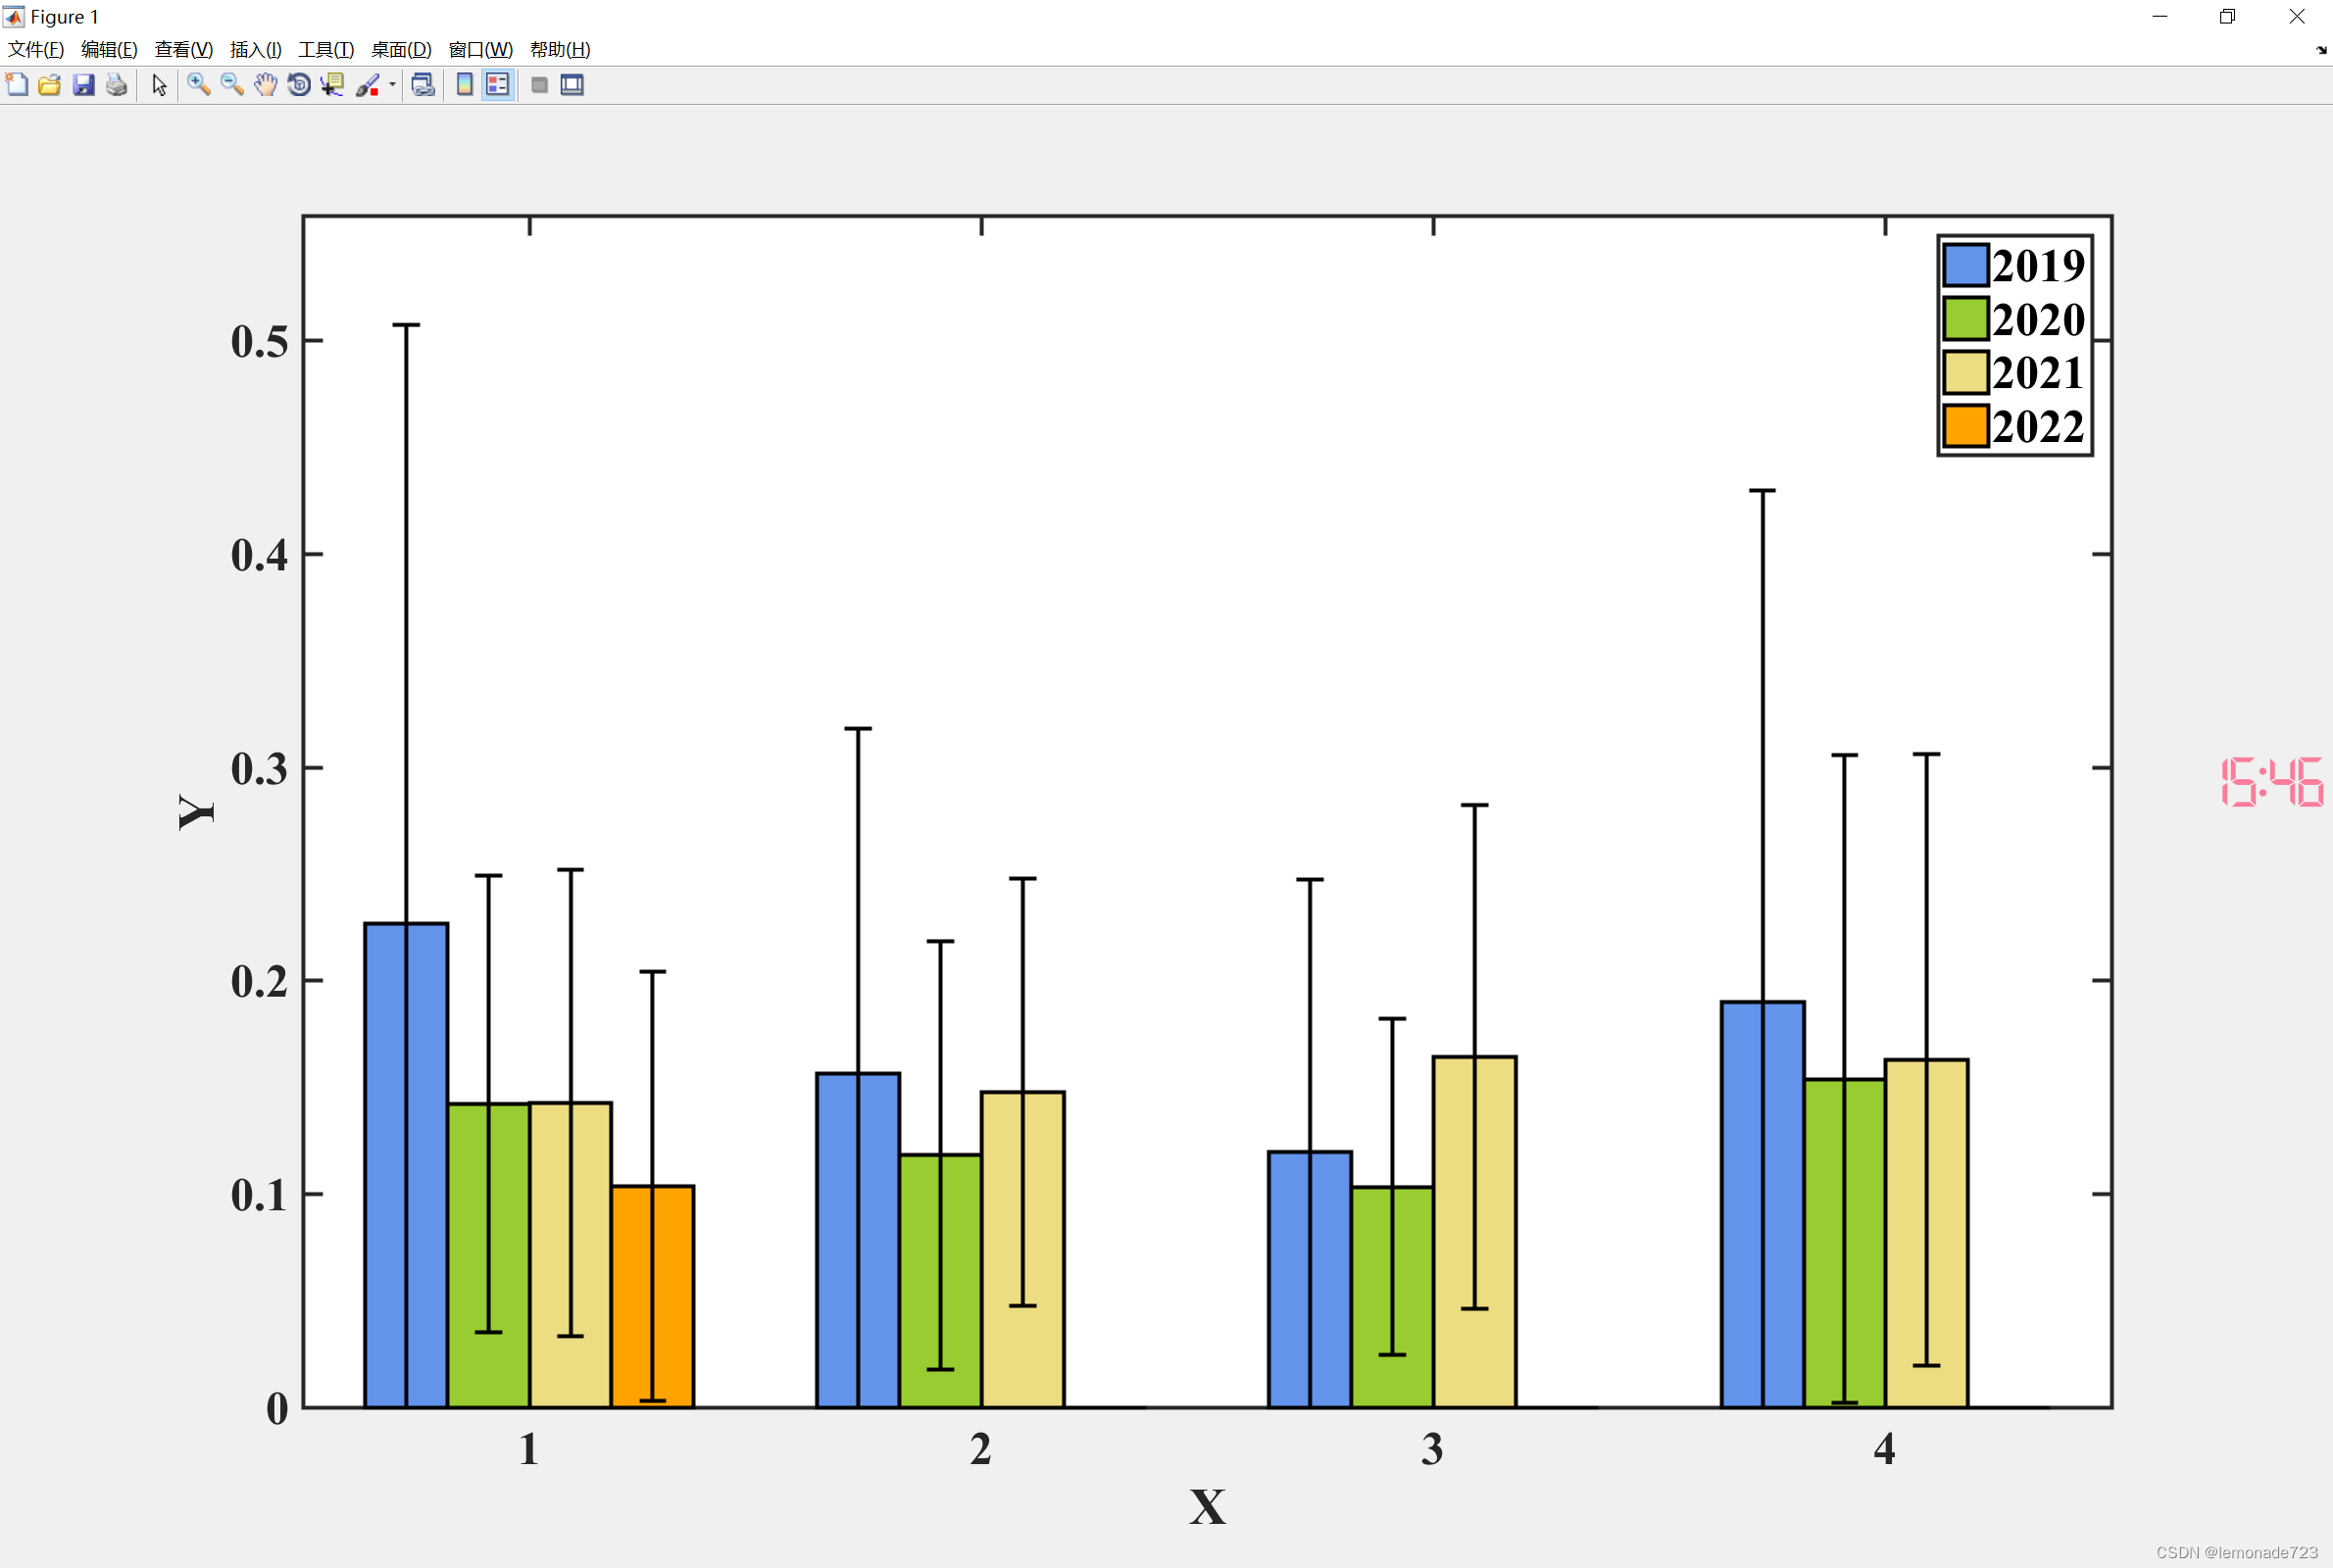
Matlab可绘制带误差线的柱状图(需下载barweb (BARgraph With Error Bars) - File Exchange - MATLAB Central并设置路径),成图如下所示。
代码:
close all;clear;clc;
X = [0.2267 0.1423 0.1427 0.1038; 0.1567 0.1184 0.1479 0; 0.1199 0.1035 0.1643 0; 0.1900 0.1540 0.1631 0]; %(系列数据)
E = [0.2808 0.1069 0.1092 0.1006; 0.1614 0.1003 0.1001 0; 0.1277 0.0789 0.1181 0; 0.2398 0.1518 0.1433 0];%(标准差)
legends = {'2019','2020','2021','2022'};%(图例)
groupnames = cell(4,1);
groupnames{1} = '1';groupnames{2} = '2';groupnames{3} = '3';groupnames{4} = '4';%(分组名称)
Title = '';
Xlabel = 'X';
Ylabel = 'Y';
barweb(X,E,1,groupnames,Title,Xlabel,Ylabel,jet,'none',legends,2,'plot');
设置配色及颜色对应可参考:
Matlab-RGB-颜色对照表(0-1之间取值)_循香而落的博客-CSDN博客_matlab颜色代码rgb
设置坐标轴和图例字体、大小可参考:
matlab——修改图中字体_DWQY的博客-CSDN博客_matlab图片字体
如果使用高版本Matlab,运行过程过程中可能会遇到以下(以及其他)问题
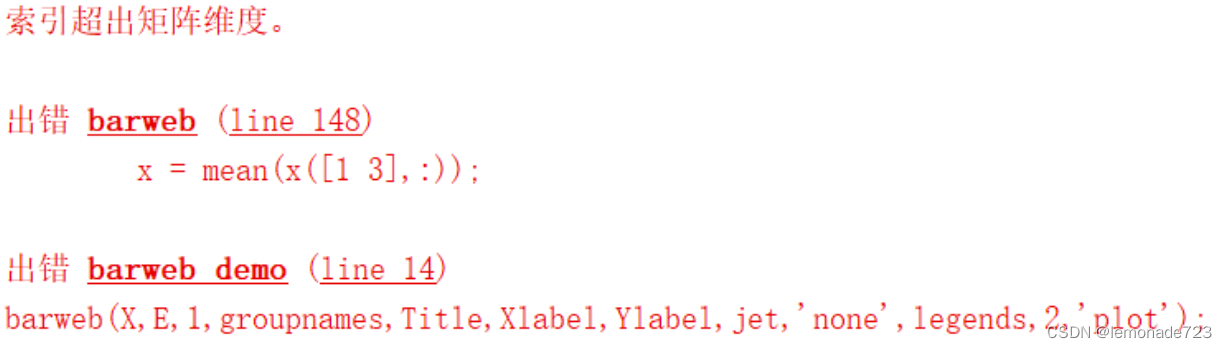
解决方式详见
在Matlab中使用barweb绘制带方差的分组柱状图时的几个注意事项_jbb0523的博客-CSDN博客
最后贴一下我自己修改后的代码(Maltab R2016a版本):
function handles = barweb(barvalues, errors, width, groupnames, bw_title, bw_xlabel, bw_ylabel, bw_colormap, gridstatus, bw_legend, error_sides, legend_type)

%
% Usage: handles = barweb(barvalues, errors, width, groupnames, bw_title, bw_xlabel, bw_ylabel, bw_colormap, gridstatus, bw_legend, error_sides, legend_type)
%
% Ex: handles = barweb(my_barvalues, my_errors, [], [], [], [], [], bone, [], bw_legend, 1, 'axis')
%
% barweb is the m-by-n matrix of barvalues to be plotted.
% barweb calls the MATLAB bar function and plots m groups of n bars using the width and bw_colormap parameters.
% If you want all the bars to be the same color, then set bw_colormap equal to the RBG matrix value ie. (bw_colormap = [1 0 0] for all red bars)
% barweb then calls the MATLAB errorbar function to draw barvalues with error bars of length error.
% groupnames is an m-length cellstr vector of groupnames (i.e. groupnames = {'group 1'; 'group 2'}).  For no groupnames, enter [] or {}
% The errors matrix is of the same form of the barvalues matrix, namely m group of n errors.
% Gridstatus is either 'x','xy', 'y', or 'none' for no grid.
% No legend will be shown if the legend paramter is not provided
% 'error_sides = 2' plots +/- std while 'error_sides = 1' plots just + std
% legend_type = 'axis' produces the legend along the x-axis while legend_type = 'plot' produces the standard legend.  See figure for more details
%
% The following default values are used if parameters are left out or skipped by using [].
% width = 1 (0 < width < 1; widths greater than 1 will produce overlapping bars)
% groupnames = '1', '2', ... number_of_groups
% bw_title, bw_xlabel, bw_ylabel = []
% bw_color_map = jet
% gridstatus = 'none'
% bw_legend = []
% error_sides = 2;
% legend_type = 'plot';
%
% A list of handles are returned so that the user can change the properties of the plot
% handles.ax: handle to current axis
% handles.bars: handle to bar plot
% handles.errors: a vector of handles to the error plots, with each handle corresponding to a column in the error matrix
% handles.legend: handle to legend
%
%
% See the MATLAB functions bar and errorbar for more information
%
% Author: Bolu Ajiboye
% Created: October 18, 2005 (ver 1.0)
% Updated: Dec 07, 2006 (ver 2.1)
% Updated: July 21, 2008 (ver 2.3)

% Get function arguments
if nargin < 2
	error('Must have at least the first two arguments:  barweb(barvalues, errors, width, groupnames, bw_title, bw_xlabel, bw_ylabel, bw_colormap, gridstatus, bw_legend, barwebtype)');
elseif nargin == 2
	width = 1;
	groupnames = 1:size(barvalues,1);
	bw_title = [];
	bw_xlabel = [];
	bw_ylabel = [];
	bw_colormap = jet;
	gridstatus = 'none';
	bw_legend = [];
	error_sides = 2;
	legend_type = 'plot';
elseif nargin == 3
	groupnames = 1:size(barvalues,1);
	bw_title = [];
	bw_xlabel = [];
	bw_ylabel = [];
	bw_colormap = jet;
	gridstatus = 'none';
	bw_legend = [];
	error_sides = 2;
	legend_type = 'plot';
elseif nargin == 4
	bw_title = [];
	bw_xlabel = [];
	bw_ylabel = [];
	bw_colormap = jet;
	gridstatus = 'none';
	bw_legend = [];
	error_sides = 2;
	legend_type = 'plot';
elseif nargin == 5
	bw_xlabel = [];
	bw_ylabel = [];
	bw_colormap = jet;
	gridstatus = 'none';
	bw_legend = [];
	error_sides = 2;
	legend_type = 'plot';
elseif nargin == 6
	bw_ylabel = [];
	bw_colormap = jet;
	gridstatus = 'none';
	bw_legend = [];
	error_sides = 2;
	legend_type = 'plot';
elseif nargin == 7
	bw_colormap = jet;
	gridstatus = 'none';
	bw_legend = [];
	error_sides = 2;
	legend_type = 'plot';
elseif nargin == 8
	gridstatus = 'none';
	bw_legend = [];
	error_sides = 2;
	legend_type = 'plot';
elseif nargin == 9
	bw_legend = [];
	error_sides = 2;
	legend_type = 'plot';
elseif nargin == 10
	error_sides = 2;
	legend_type = 'plot';
elseif nargin == 11
	legend_type = 'plot';
end

change_axis = 0;
ymax = 0;

if size(barvalues,1) ~= size(errors,1) || size(barvalues,2) ~= size(errors,2)
	error('barvalues and errors matrix must be of same dimension');
else
	if size(barvalues,2) == 1
		barvalues = barvalues';
		errors = errors';
	end
	if size(barvalues,1) == 1
		barvalues = [barvalues; zeros(1,length(barvalues))];
		errors = [errors; zeros(1,size(barvalues,2))];
		change_axis = 1;
	end
	numgroups = size(barvalues, 1); % number of groups
	numbars = size(barvalues, 2); % number of bars in a group
	if isempty(width)
		width = 1;
	end

	% Plot bars
	handles.bars = bar(barvalues, width,'edgecolor','k', 'linewidth', 2);
	hold on
	if ~isempty(bw_colormap)
        barmap=[0.39 0.58 0.92; 0.60 0.80 0.196; 0.93 0.87 0.51; 1 0.64 0];
		colormap(barmap);
	else
		colormap(barmap);
	end
	if ~isempty(bw_legend) && ~strcmp(legend_type, 'axis')
		handles.legend = legend(bw_legend, 'fontsize', 24);
	else
		handles.legend = [];
	end

	% Plot erros
	for i = 1:numbars
		x = handles.bars(i).XData + handles.bars(i).XOffset;
		handles.errors(i) = errorbar(x, barvalues(:,i), errors(:,i), 'k', 'linestyle', 'none', 'linewidth', 2);
		ymax = max([ymax; barvalues(:,i)+errors(:,i)]);
	end

	if error_sides == 1
		set(gca,'children', flipud(get(gca,'children')));
	end

	ylim([0 ymax*1.1]);
	xlim([0.5 numgroups-change_axis+0.5]);

	if strcmp(legend_type, 'axis')
		for i = 1:numbars
			xdata = get(handles.errors(i),'xdata');
			for j = 1:length(xdata)
				text(xdata(j),  -0.03*ymax*1.1, bw_legend(i), 'Rotation', 60, 'fontsize', 24, 'HorizontalAlignment', 'right');
			end
		end
		set(gca,'xaxislocation','top');
	end

	if ~isempty(bw_title)
		title(bw_title, 'fontsize',24,'FontWeight','bold','FontName','Times New Roman');
	end
	if ~isempty(bw_xlabel)
		xlabel(bw_xlabel, 'fontsize',24,'FontWeight','bold','FontName','Times New Roman');
	end
	if ~isempty(bw_ylabel)
		ylabel(bw_ylabel, 'fontsize',24,'FontWeight','bold','FontName','Times New Roman');
	end

	set(gca, 'xticklabel', groupnames, 'box', 'on', 'ticklength', [.01 .01], 'fontsize', 24,'FontWeight','bold','FontName','Times New Roman', 'xtick',1:numgroups, 'linewidth', 2,'xgrid','off','ygrid','off');
	if ~isempty(gridstatus) && any(gridstatus == 'x')
		set(gca,'xgrid','on');
    end

	if ~isempty(gridstatus) && any(gridstatus ==  'y')
		set(gca,'ygrid','on');
	end

	handles.ax = gca;

	hold off
end