【记录爬虫实战过程】入门学习·详细过程·爬取天气信息并通过pyecharts进行可视化展示1
前言
入门学习这个部分是跟着b站教学视频做的,记录了所有过程和代码。
然后在此基础上自己进行了扩展,简单地搭建了一个flask页面,可以自己输入要查找的城市和年份,返回该城市这一年的平均天气情况。
这是记录自我扩展部分的文章进阶学习·详细过程·爬取天气信息1(python+flask+pyecharts)
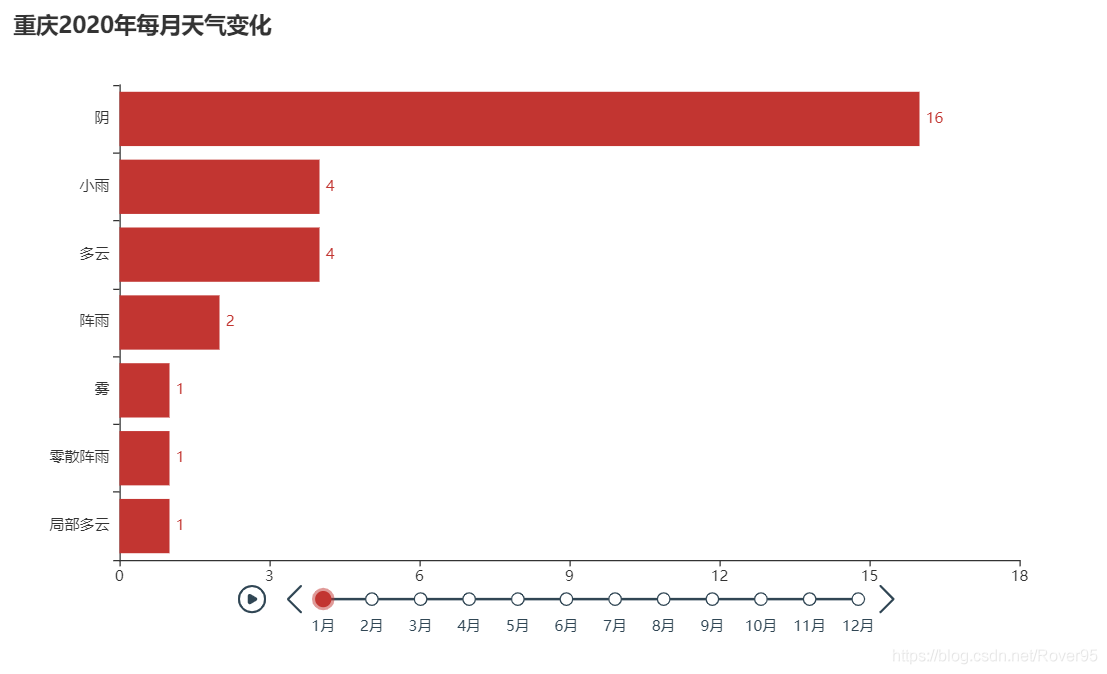
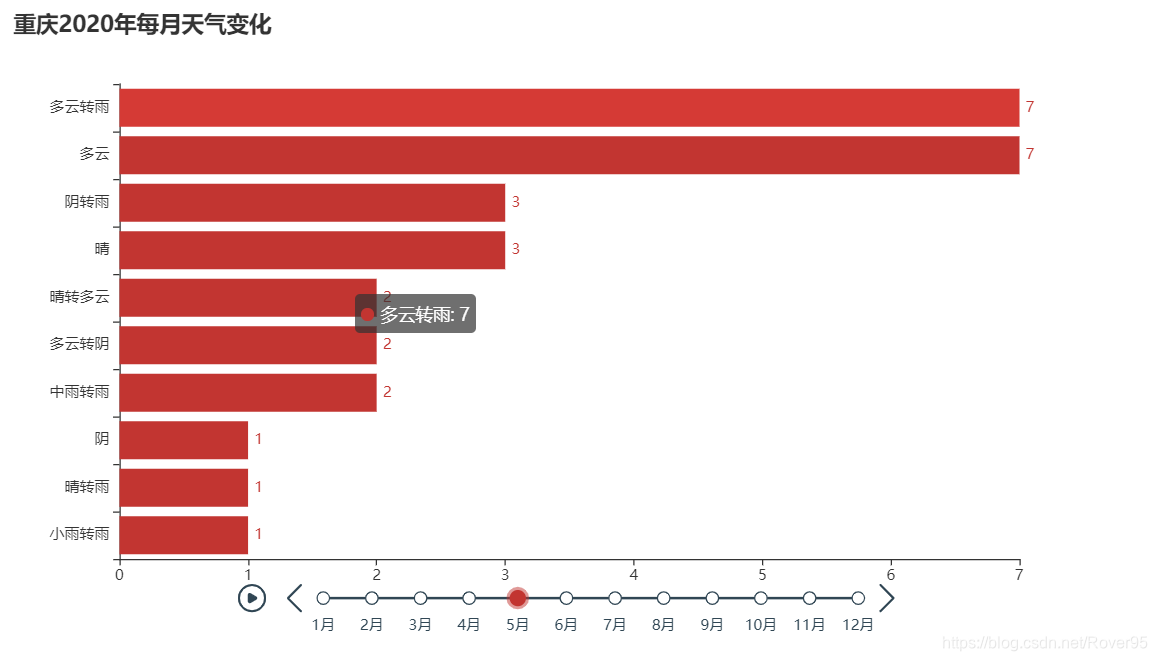
入门学习的效果图:用pyecharts做了一个时间轴,以可视化形式展示了每个月各种天气的对应次数
本篇会记录详细过程、遇到的问题及解决方案和全部代码的展示
照着代码敲就可以,基本不需要什么基础(毕竟我也是个新手,正在学习过程中)
正文
第一部分:数据爬取+处理
1.导入对应模块
import requests  #替代浏览器进行网络请求
from lxml import etree  #进行数据预处理
import csv  #写入csv文件
2.确定爬取的网站
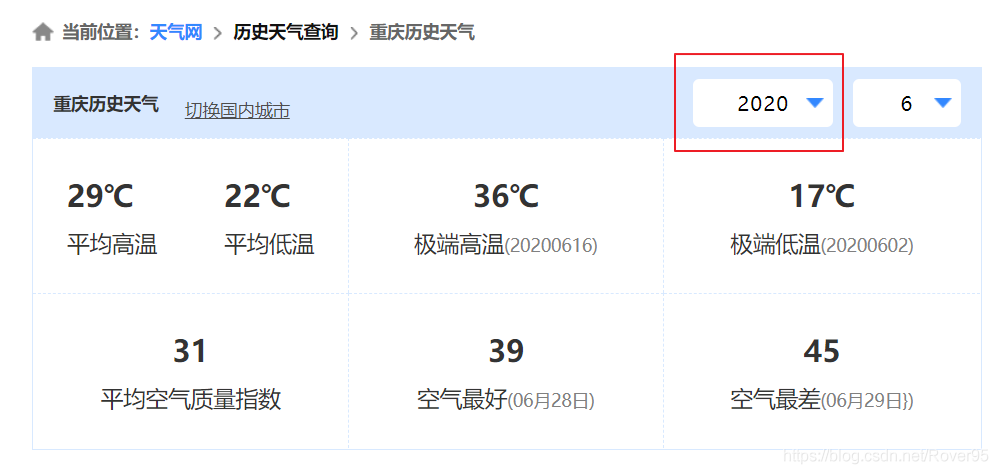
爬取网站为:https://lishi.tianqi.com/
选择对应的城市,此处我选择重庆,即爬取 https://lishi.tianqi.com/chongqing/ 网站内的天气信息
因为要爬取全年的信息,所以选择去年的天气
发现每个月天气对应的网站链接是有规律的
选择一月

选择六月

即发现url规律为 https://lishi.tianqi.com/chongqing/+年份+月份.html
将中间的“年份+月份”的变量命名为weather_time
其中,某些月份对应的数字需要进行处理,比如六月份要写成06,而不是6
将得到的月份信息都转化成string类型
'''得到url'''
#发现url规律  +年份+月份.html
for month in range(1,13): #range()左闭右开
    #某年某月的天气信息
    if month<10:
        weather_time='2020'+('0'+str(month))
    else:
        weather_time='2020'+str(month)

    #也可以将上面的写成简洁的三元表达式
    #weather_time='2019'+('0'+str(month) if month<10 else str(month))

    url=f'https://lishi.tianqi.com/chongqing/{weather_time}.html'
3.得到数据
得到网站后,爬取天气信息并封装代码
写一个函数getWeather(url) 用于获取天气信息
3.1.
先在里面构造一个空列表weather_info=[],存储信息格式为[{‘日期’:…,‘最高气温’:…,‘天气’:…},{‘日期’:…,‘最高气温’:…,‘天气’:…}…],即记录每个日期对应的最高气温,天气等等信息
3.2.
设置一个请求头header。(如何得到该请求头请自行百度,很简单
3.3.
用 requests.get(url,headers)发起请求
3.4.
用xpath进行数据预处理,存入res_list。这个xpath讲解视频 比较简单易懂,我觉得用于初学者进行简单的分析以及足够了
以下就是目前所写代码,至此已经得到对应数据了
'''得到天气数据'''
def getWeather(url):
    weather_info=[] #[{'日期':...,'最高气温':...,'天气':...},{'日期':...,'最高气温':...,'天气':...}...]
    #设置一个请求头
    headers={
    'User-Agent':'Mozilla/5.0 (Windows NT 10.0; Win64; x64) AppleWebKit/537.36 (KHTML, like Gecko) Chrome/64.0.3282.204 Safari/537.36',
    'content-type':'charst=uft8' #设置接收数据的编码格式
    }
    #发起请求
    res=requests.get(url,headers=headers)
    #数据预处理 xpath
    res_html=etree.HTML(res.text)
    #xpath提前当前页所有数据(每个月)
    #res_list=res_html.xpath("//div[@class='main clearfix']//ul[@class='thrui']/li") #这串代码也是可以的,只不过下面的更简洁
    res_list=res_html.xpath("//ul[@class='thrui']/li")
然后需要对数据进行解析
3.5 写一个for循环,得到每日数据后添加到每月数据
3.5.1.
新建一个字典day_weather_info用于存入每日数据信息
3.5.2.
得到每日日期,格式为{‘data time’:‘2020-05-01’},所以只取“2020-01-01 星期三”这一个首项,即div[1]。(因为是li下面的第一个div)
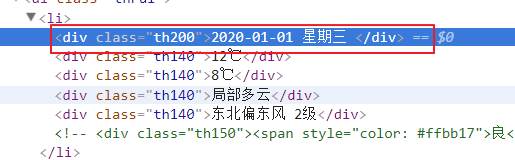
又因为中间有空格符,所以用split(’ ')进行处理
3.5.3.
得到最高气温,去掉℃符号
3.5.4.
同理,得到最低气温
3.5.5
得到天气状况
#for循环迭代变量每日数据
    for li in res_list:
        #每天的数据放入字典
        day_weather_info={}
        #日期 {'data time':'2020-05-01'}
        #li.xpath{'./div[1]/text()'}[0]代表“2020-05-01 星期五”这一个首项,又因为中间有空格符,所以要处理
        day_weather_info['data time']=li.xpath('./div[1]/text()')[0].split(' ')[0] #以空格为分隔符,取首项
        #最高气温
        high=li.xpath('./div[2]/text()')[0]
        #对最高气温的数据进行处理,去掉℃符号,将28℃变成28
        #字符串切割 索引
        day_weather_info['high']=high[:high.find('℃')]
        #同理,处理最低气温
        low=li.xpath('./div[3]/text()')[0]
        day_weather_info['low']=low[:low.find('℃')]

        #天气状况
        day_weather_info['weather']=li.xpath('./div[4]/text()')[0]

        #将每日天气添加到每月天气
        weather_info.append(day_weather_info)
3.6.
函数末尾,可以打印得到的天气信息(记得注释掉)
print(weather_info)
最后返回函数值weather_info
以下是完整的函数
'''得到天气数据'''
def getWeather(url):
    weather_info=[] #[{'日期':...,'最高气温':...,'天气':...},{'日期':...,'最高气温':...,'天气':...}...]
    #设置一个请求头
    headers={
    'User-Agent':'Mozilla/5.0 (Windows NT 10.0; Win64; x64) AppleWebKit/537.36 (KHTML, like Gecko) Chrome/64.0.3282.204 Safari/537.36',
    'content-type':'charst=uft8' #设置接收数据的编码格式
    }
    #发起请求
    res=requests.get(url,headers=headers)
    #数据预处理 xpath
    res_html=etree.HTML(res.text)
    #xpath提前当前页所有数据(每个月)
    #res_list=res_html.xpath("//div[@class='main clearfix']//ul[@class='thrui']/li") #这串代码也是可以的,只不过下面的更简洁
    res_list=res_html.xpath("//ul[@class='thrui']/li")

    #for循环迭代变量每日数据
    for li in res_list:
        #每天的数据放入字典
        day_weather_info={}
        #日期 {'data time':'2020-05-01'}
        #li.xpath{'./div[1]/text()'}[0]代表“2020-05-01 星期五”这一个首项,又因为中间有空格符,所以要处理
        day_weather_info['data time']=li.xpath('./div[1]/text()')[0].split(' ')[0] #以空格为分隔符,取首项
        #最高气温
        high=li.xpath('./div[2]/text()')[0]
        #对最高气温的数据进行处理,去掉℃符号,将28℃变成28
        #字符串切割 索引
        day_weather_info['high']=high[:high.find('℃')]
        #同理,处理最低气温
        low=li.xpath('./div[3]/text()')[0]
        day_weather_info['low']=low[:low.find('℃')]

        #天气状况
        day_weather_info['weather']=li.xpath('./div[4]/text()')[0]

        #将每日天气添加到每月天气
        weather_info.append(day_weather_info)

    #返回数据
    #print(weather_info)
    return weather_info
4.数据处理
得到每个月的天气信息后,写入总的天气信息里面
先创建一个空列表,用于存放所有的天气信息
weathers=[]
再通过 getWeather(url)函数得到每个月的天气信息,用append()将其加入到weathers列表里面
#爬虫获取每个月的天气数据
    weather=getWeather(url)
    #将每月数据汇总
    weathers.append(weather)
最后可以检查一下(记得检查完注释掉)
print(weathers)
5.将所得数据写入CSV
选择一次性写入,防止I/O过于密集
用到with open()函数,里面具体参数含义就不详细展开了
首先创建一个写入对象writer=csv.writer(csvfile)
然后对确定表格列名为[‘日期’,‘最高气温’,‘最低气温’,‘天气’],用writerow()函数来写*(注意此处没有s)*
因为是一次性写入数据,所以使用writerrows()函数,一行一行地写入数据
可以采用这行代码,比较简洁
writer.writerows([list(day_weather_dict.values()) for month_weather in weathers for day_weather_dict in month_weather])
但个人觉得比较难读懂,我更倾向于一步一步写
从每月天气month_weather中得到每日天气数据day_weather_dict,month_weather又是从总的天气数据weathers中得到。将day_weather_dict的值转换成列表形式后汇总,放到list_year里面
list_year=[]
for month_weather in weathers:
        for day_weather_dict in month_weather:
            list_year.append(list(day_weather_dict.values())) #把日数据的值转换成列表,再放到年数据里面
以下是总的代码:
#数据写入CSV(一次性,防止I/O过于密集)
#newline代表另起一行时,要在这行前面加什么东西,此处不加东西
with open('weather.csv','w',newline='',encoding='utf-8') as csvfile:
    #新建一个写入对象
    writer=csv.writer(csvfile)

    #写入表格列名:column_name
    writer.writerow(['日期','最高气温','最低气温','天气'])
    #一次性写入多行用writerrows(写入的数据是列表,一个列表对应一行)
    #writer.writerows([list(day_weather_dict.values()) for month_weather in weathers for day_weather_dict in month_weather])
    list_year=[]
    for month_weather in weathers:
        for day_weather_dict in month_weather:
            list_year.append(list(day_weather_dict.values())) #把日数据的值转换成列表,再放到年数据里面
    #写入年数据
    writer.writerows(list_year)
完整代码
上面的所有代码我都放在weather.py这个文件里面的,以下是第一部分的全部代码
第一部分完结撒花ヾ(✿゚▽゚)ノ
from os import write
import requests  #替代浏览器进行网络请求
from lxml import etree  #进行数据预处理
import csv  #写入csv文件

#全年的天气数据
weathers=[]

'''得到天气数据'''
def getWeather(url):
    weather_info=[] #[{'日期':...,'最高气温':...,'天气':...},{'日期':...,'最高气温':...,'天气':...}...]
    #设置一个请求头
    headers={
    'User-Agent':'Mozilla/5.0 (Windows NT 10.0; Win64; x64) AppleWebKit/537.36 (KHTML, like Gecko) Chrome/64.0.3282.204 Safari/537.36',
    'content-type':'charst=uft8' #设置接收数据的编码格式
    }
    #发起请求
    res=requests.get(url,headers=headers)
    #数据预处理 xpath
    res_html=etree.HTML(res.text)
    #xpath提前当前页所有数据(每个月)
    #res_list=res_html.xpath("//div[@class='main clearfix']//ul[@class='thrui']/li") #这串代码也是可以的,只不过下面的更简洁
    res_list=res_html.xpath("//ul[@class='thrui']/li")

    #for循环迭代变量每日数据
    for li in res_list:
        #每天的数据放入字典
        day_weather_info={}
        #日期 {'data time':'2020-05-01'}
        #li.xpath{'./div[1]/text()'}[0]代表“2020-05-01 星期五”这一个首项,又因为中间有空格符,所以要处理
        day_weather_info['data time']=li.xpath('./div[1]/text()')[0].split(' ')[0] #以空格为分隔符,取首项
        #最高气温
        high=li.xpath('./div[2]/text()')[0]
        #对最高气温的数据进行处理,去掉℃符号,将28℃变成28
        #字符串切割 索引
        day_weather_info['high']=high[:high.find('℃')]
        #同理,处理最低气温
        low=li.xpath('./div[3]/text()')[0]
        day_weather_info['low']=low[:low.find('℃')]

        #天气状况
        day_weather_info['weather']=li.xpath('./div[4]/text()')[0]

        #将每日天气添加到每月天气
        weather_info.append(day_weather_info)

    #返回数据
    #print(weather_info)
    return weather_info

'''得到url'''
#发现url规律  +年份+月份.html
for month in range(1,13): #左闭右开
    #某年某月的天气信息
    if month<10:
        weather_time='2020'+('0'+str(month))
    else:
        weather_time='2020'+str(month)

    #三元表达式
    #weather_time='2019'+('0'+str(month) if month<10 else str(month))

    url=f'https://lishi.tianqi.com/chongqing/{weather_time}.html'
    #爬虫获取每个月的天气数据
    weather=getWeather(url)
    #将每月数据汇总
    weathers.append(weather)

#print(weathers)

#数据写入CSV(一次性,防止I/O过于密集)
#newline代表另起一行时,要在这行前面加什么东西,此处不加东西
with open('weather.csv','w',newline='',encoding='utf-8') as csvfile:
    #新建一个写入对象
    writer=csv.writer(csvfile)

    #写入表格列名:column_name
    writer.writerow(['日期','最高气温','最低气温','天气'])
    #一次性写入多行用writerrows(写入的数据是列表,一个列表对应一行)
    #writer.writerows([list(day_weather_dict.values()) for month_weather in weathers for day_weather_dict in month_weather])
    list_year=[]
    for month_weather in weathers:
        for day_weather_dict in month_weather:
            list_year.append(list(day_weather_dict.values())) #把日数据的值转换成列表,再放到年数据里面
    #写入年数据
    writer.writerows(list_year)
补充:数据可视化
第二部分 的文章链接
将数据进行可视化展示