【echarts】横向柱状图(条形图)渐变色,手把手教学
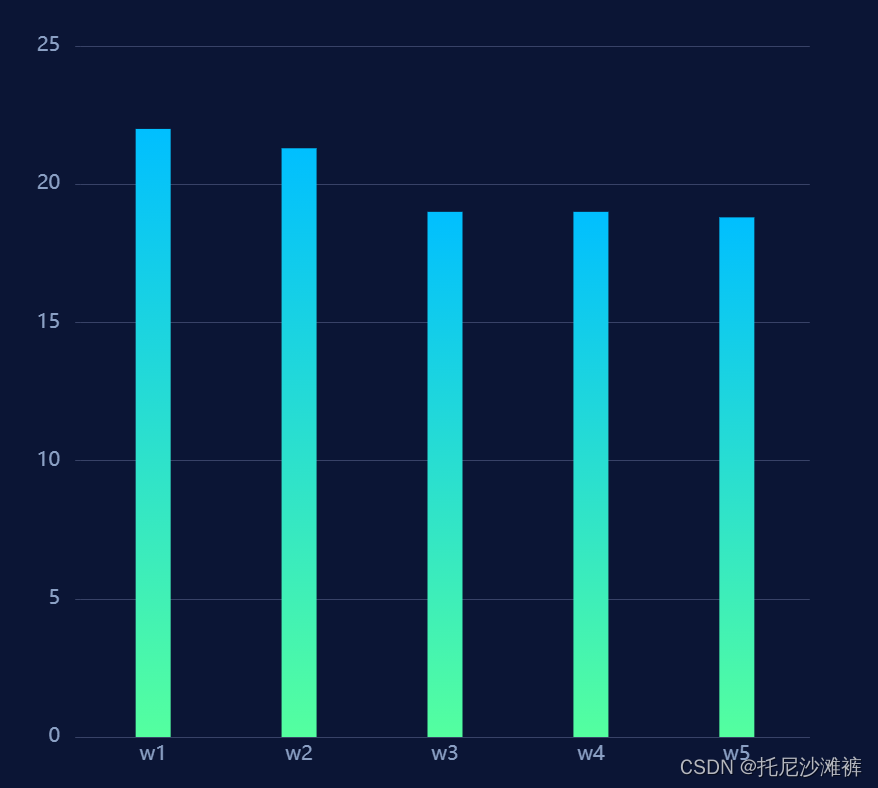
通常的柱状图
渐变色非的简单

series: [
          {
            type: 'bar',
            data: this.rank.num,
            barWidth: '10%',
            itemStyle: {
              color: {
                type: 'linear',
                x: 0,
                y: 0,
                x2: 0,
                y2: 1,
                colorStops: [{
                  offset: 0, color: '##00BFFF' // 0% 处的颜色
                }, {
                  offset: 1, color: '#54FF9F' // 100% 处的颜色
                }],
                global: false // 缺省为 false
              }

            }
          }
        ]
横向的图表却不能照搬
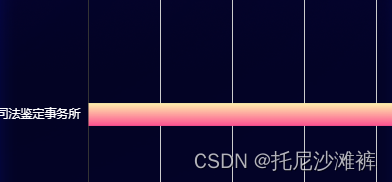
因为渐变还是自下而上的就像这样:

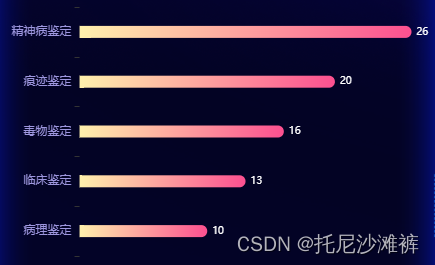
在横向的图表中我们希望渐变是从左到右的

这种效果只需要改一下color的配置
```javascript
series: [
          {
            type: 'bar',
            barWidth: 12,
            data: this.justice.num,
            itemStyle: {
              barBorderRadius: [0, 20, 20, 0],
              color: new this.$echarts.graphic.LinearGradient(0, 0, 1, 0, [ // color在这里
                {
                  offset: 0,
                  color: '#FFF1AD'
                },
                {
                  offset: 1,
                  color: '#FC5090'
                }
              ])

            },
            label: {
              normal: {
                show: true,
                lineHeight: 10,
                formatter: '{c}',
                position: 'right',
                textStyle: {
                  color: '#fff',
                  fontSize: 10
                }
              }
            }
          }
        ]